Quick Reference: Common Failure Modes
Select a failure mode below to view preservation risks, chemical triggers, and stabilization strategies.
Animation Cel Preservation Guide: Storage Tiers & Lifetime Risk
Animation cels don’t simply “age.” They follow the same reliability curve that governs engineered materials: an early drift phase, a long stable window, and an accelerated wear-out period driven by chemical kinetics and environmental stress. Vinegar syndrome is not random decay — it is a chemical failure mode governed by heat, water activity, and feedback from trapped acetic acid.
Collectors are often told that storage is “good,” “archival,” or “museum-grade,” but those labels rarely correspond to measurable environmental control. A frame, a binder, or a box is only as safe as the physics inside it. Warm rooms accelerate acid generation. Sealed volumes trap it. Cold storage can be either highly protective or mechanically destructive depending on moisture and cycling. Marketing language cannot resolve these contradictions — but a risk-based engineering framework can.
This document applies tools normally used for mission-critical systems — reliability curves, functional requirements, failure modes, Arrhenius kinetics, and diffusion-limited mass transfer — to animation cel preservation. Instead of treating storage choices as opinions, we evaluate them through three independent likelihood vectors:
- Chemical (Lchem) — hydrolysis rate from temperature, absolute humidity, and acid feedback.
- Structural (Lstruct) — mechanical fatigue from compression, RH cycling, thermal cycling, and geometry.
- Photochemical (Luv) — UV and visible-light dose.
These vectors feed a unified likelihood score that captures how fast a cel moves along the vinegar-syndrome curve. Preservation tiers are then defined by measured improvements in these vectors, not by product labels. The result is a transparent, physics-based way to classify frames, binders, boxes, and engineered microclimates — and to design future systems that are objectively safer.
What is the Preservation Tier Framework?
The Cel Nexus Preservation Tiers are an engineering standard for animation art storage. They range from Tier 5 (High Risk), such as unbuffered attics, to Tier 1 (Archival Cold Storage), which uses temperature and humidity control to extend cel lifespan by 400% or more.
Archival Lifecycle Context: Preservation, Conservation, and Restoration
Before introducing the preservation framework, it is useful to establish the broader archival lifecycle. Animation cels pass through three distinct phases of technical care, each with its own intent and method. Understanding these phases clarifies the scope of this document.
1. Preservation — maintaining stability and preventing degradation
Preservation focuses on maintaining a stable microenvironment so the acetate base never enters the degradation regime. For cellulose acetate, this primarily involves controlling the factors that dictate the rate of hydrolysis and the accumulation of acetic acid:
- Temperature
- Absolute humidity
- Boundary-layer behavior
- Off-gas removal pathways (venting or scavenging)
Effective preservation suppresses R (acid generation) and prevents D (acid accumulation). The framework that follows is centered entirely on this phase.
2. Conservation — intervening once early deterioration is detectable
Conservation addresses early chemical or physical changes while the cel remains structurally sound. It includes controlled conditioning environments, acid-reduction strategies, and stabilization measures designed to re-establish favorable conditions before significant damage develops.
This phase is referenced for context but is not the focus of this document.
3. Restoration — correcting visible or structural damage
Restoration is reserved for advanced deterioration that compromises visual or physical integrity. It includes repair of paint loss, correction of severe warping or brittleness, reinforcement of weakened material, and other invasive treatments.
This phase lies outside the scope of engineered preservation.
Purpose of defining this lifecycle
Defining the archival lifecycle establishes a clear boundary for the analysis that follows. The framework in this document does not attempt to address conservation or restoration workflows. It provides a structured preservation model focused on understanding acid generation, acid accumulation, and the environmental controls required to avoid entering the degradation regime.
CTA Preservation Risk & Mitigation Framework
This section turns cellulose triacetate (CTA) preservation into a formal risk problem instead of a set of vague rules (“cool and dry”, “use archival frames”). We treat the storage environment like an engineered system, using Reliability-Centered Maintenance (RCM) and FMEA-style logic to ask a simple question: “How hard is this environment pushing my cel toward failure?”
TL;DR – How this framework works
- We separate environment aggressiveness (likelihood, L) from the cel’s current condition (consequence, C). A Tier-1 box is Tier-1 whether it holds a mint cel or a damaged one.
-
The environment is scored along three vectors:
chemical (
Lchem– hydrolysis & VS), structural (Lstruct– RH cycling & mechanics), and UV/light (Luv– dose, spectrum, duration). -
Chemistry gets a physics model.
Lchemis derived from Arrhenius temperature factors, absolute humidity / water activity, and microenvironment behavior (dilution vs. trapping), not from gut feel. - Structural and UV vectors are scored qualitatively for now, using engineering judgement (how much cycling? how much handling? how much light?), all mapped onto the same 1–5 likelihood ladder.
-
For quick comparisons we use a weighted summary:
Leff = 0.50·Lchem + 0.25·Lstruct + 0.25·Luv, reflecting that chemical decay is inevitable if unchecked, while structural and UV risks depend more on use and handling. -
Tier assignment is still conservative.
The overall environment tier is limited by the worst vector
(a “veto rule”), so a setup with excellent chemistry but very bad mechanics
cannot be scored as Tier-1 just because
Lchemis low. -
In dark storage,
Luveffectively sits at the bottom of the scale and mostly drops out; for display, it rises and becomes a meaningful part ofLeff.
Acid Generation vs Acid Emission – The Two Axes of Preservation
Most conversations about acetate degradation focus only on what you can smell or measure in the air: acetic acid vapor. That’s important, but it’s only half of the story. Real preservation has to manage both acid generation inside the cel and acid emission out of the cel.
Acid Generation (R) – What the Cel Produces Internally
Cellulose triacetate (CTA) slowly breaks down by hydrolysis. Every time a chain scission happens, a little more acetic acid is created inside the film. The rate of this reaction, which we’ll call R, is controlled primarily by:
- Temperature – warmer storage dramatically accelerates hydrolysis (Arrhenius behavior).
- Absolute humidity – more available water means more hydrolysis events per unit time.
- Local acidity – once enough acid accumulates, the reaction becomes autocatalytic.
Hydrolysis is the irreversible step. Once a chain is broken and acid is generated, you cannot
“un-react” the polymer – you can only slow future reactions and remove the acid that was created.
Acid Emission (D) – What Leaves the Cel Into the Environment
The acid generated inside the film still has to escape. That outward movement, driven by a concentration / partial-pressure gradient, is our diffusion and emission term, which we’ll call D. D depends on:
- Film permeability and thickness – thicker CTA and certain formulations slow diffusion.
- Paint coverage and stuck layers – paint, inks, and tight stacks act as diffusion barriers.
- External vapor concentration – if the air right next to the cel is kept near 0 ppm, acid is “pulled” out faster; if the surrounding air is saturated, emission slows or reverses.
- Presence of a scavenger – molecular sieves, MicroChamber boards, and other sorbents can create a strong sink that keeps the vapor concentration low.
Emission and diffusion are the reversible half of the problem. R creates new acid; D is how we make
sure that acid is removed from the film as quickly as possible instead of being recycled back into it.
Why You Have to Control Both
Collectors often optimise only for one axis without realizing it:
- “Let it breathe” in room air: improves emission (D) a bit by giving acid a large space to diffuse into, but can massively increases generation (R) because temperature and humidity are uncontrolled.
- Closed box with no scavenger: slows generation (R) by buffering temperature and humidity, but emission (D) becomes the bottleneck and vapor can build up in the small volume.
When we talk about “tiers of preservation” below, we’re really asking two questions for each setup: (1) What does this do to the hydrolysis rate R? and (2) What does this do to the emission / diffusion rate D? Low‑tier environments push one or both in the wrong direction; high‑tier setups deliberately control both.
The Two Degrading Regimes: Why "No Smell" Doesn't Mean "Safe"
A common misconception is that a cel is only "failing" if it exhibits the pungent odor of vinegar syndrome. In reality, CTA degradation operates in two distinct chemical regimes. Understanding the difference is the key to proactive preservation.
Key idea: You can’t stop hydrolysis completely — you can only control which regime it runs in. Good preservation pushes the cel out of the acid-accelerated (runaway) regime and into the slow baseline (Arrhenius/hydrophilic) regime, then stretches that timeline with temperature and humidity control.
1. The Induction Regime (Slow Hydrolysis)
The Mechanism: This is the "baseline clock" governed by the Arrhenius effect. Hydrolysis occurs at a slow, constant rate, gradually breaking polymer chains (chain scission).
The "Silent" Failure: Acetic acid is produced but hasn't reached the catalytic threshold. Failure here is often mechanical: the cel becomes brittle, shrinks, or suffers from plasticizer migration (appearing oily or cloudy) long before it smells.
2. The Autocatalytic Regime (Runaway VS)
The Mechanism: Once internal acidity hits a critical threshold (typically pH 4.0–4.5 or 0.5 on the IPI scale), the acetic acid itself begins to catalyze the reaction.
The Feedback Loop: This is a "runaway" state where the reaction rate accelerates exponentially. The volume of off-gas overwhelms the material's ability to diffuse it, leading to the classic warped, vinegar-smelling state.
Practical takeaway: The goal of preservation is not “zero hydrolysis.” The goal is to avoid the runaway VS regime and push the cel into the slow baseline regime, then manage that long-term aging timeline through temperature and humidity.
Problem Definition
Vinegar Syndrome (VS) in triacetate cels is usually explained with over-simplified guidance, such as “keep things cool and dry” or “use archival materials.” These statements are true in a general sense but are not precise enough to support quantitative decision-making about real storage setups.
Collectors therefore struggle with questions like:
- Is a sealed frame with “archival” backing safer than a portfolio in a good room?
- Does putting a box in the fridge help, or does condensation offset the temperature benefit?
- Is a dehumidified room better than a sealed container with a desiccant pack?
- Does adding a MicroChamber® board automatically make a frame “safe” for VS?
In practice, the same piece of art can be stored in a way that feels safer (boxed, framed, slabbed, sealed), yet in reality may carry a higher chemical or structural risk than leaving it on a shelf in a well-behaved room. Many of the most common “protective” actions actually trade one failure mode for another:
- Sealing a frame may reduce dust and handling but can trap acetic acid and moisture.
- Moving a box into a fridge slows hydrolysis but may create saturated, cycling microclimates.
- Adding scavenger materials can help, but only if they can see the boundary layer and have remaining capacity.
To sort out these trade-offs, we need a framework that:
- Separates likelihood (how aggressive the environment is) from consequence (how damaged the cel is now).
- Distinguishes between chemical drivers (FM1/FM2 – hydrolysis and VS), structural drivers (FM5 – fatigue & warping), and UV/light drivers (FM4 – fading, yellowing).
- Accepts that we can model chemistry quantitatively but must treat mechanics and UV as structured judgement calls until more data exist.
- Maps common storage setups (open room, box, frame, fridge, engineered cold) onto a shared 1–5 scale so collectors can compare options.
The remainder of this section builds that framework, starting from simple “room vs. box vs. fridge” questions and
ending with a multi-vector likelihood model and environment tiers that can be plugged directly into tools, checklists,
and case studies.
Acetic Acid Mass Transport Model for CTA Cels
Fig. 1 — Mass Transport + Kinetics Model (Composite Paint + Plasticized CTA Substrate)
     +-------------------------------------------------------------+
     |                   Animation Cel Composite                   |
     |-------------------------------------------------------------|
     |  Surface Layer: Paint / Ink Stack                           |
     |    - No internal acetic acid (AA) generation                |
     |    - Acts as diffusion barrier & geometry constraint        |
     |    - Local diffusion modifier: D_paint                      |
     |-------------------------------------------------------------|
     |  Internal Phase: Plasticizer System (TPP / Phthalates)      |
     |    - Governs polymer mobility & compliance                  |
     |    - Modulates water & AA transport                         |
     |    - Time-evolving plasticizer state: P_state               |
     |-------------------------------------------------------------|
     |  Substrate: CTA Cellulose Triacetate Base                   |
     |    Inputs: Water (H₂O), Heat (T), Moisture (RH), Time        |
     |    Process: Hydrolytic Chain Scission                       |
     |    Output:  Acetic Acid (AA) Generation Rate (Q)            |
     |    Internal AA Activity: P_film                              |
     +-------------------------------------------------------------+
                           |
                           |  J(Q→D) ∝ (P_film − P_BL)
                           |  (diffusion through plasticized CTA
                           |   + paint stack; transport ∝ P_state)
                           v
     +-----------------------------------------------+
     |      Boundary Layer / Local Microenvironment  |
     |-----------------------------------------------|
     |  AA Vapor Accumulation                        |
     |  Local AA Partial Pressure: P_BL              |
     |  Effective Diffusion Coefficient: D_air       |
     +-----------------------------------------------+
                           |
                           |  J(D→E) ∝ (P_BL − P_env)
                           |  (ventilation / scavenging / dilution)
                           v
     +-----------------------------------------------+
     |      External Enclosure / Environment         |
     |-----------------------------------------------|
     |  Bulk AA Partial Pressure: P_env              |
     |  AA Removal Rate (E)                          |
     |  RH, T, and Ventilation Behavior              |
     |  Scavenger & Adsorption Performance           |
     +-----------------------------------------------+
CTA degradation occurs across two coupled but fundamentally different bottlenecks:
-
1
Internal Generation vs. Diffusion (Q → D)
Acetic acid (AA) is formed inside the polymer via hydrolysis at a rate Q. This stage is governed by the polymer's internal resistance:- The Diffusion Lag (Induction): Initially, local acid generation outpaces diffusion (Q > Jint). Because the internal diffusion coefficient Dint is low in "glassy" cellulose acetate, a high internal concentration (Cint) must build up just to create the gradient required for transport. Thus, initial pH loss is physically unavoidable.
- The Geometric Bottleneck (Mass Transport Limit): As reaction kinetics accelerate, the system hits a physical "speed limit." The maximum flux Jmax is restricted by the polymer's free volume. Once Q > Jmax, the system can no longer equilibrate, forcing the internal environment past the autocatalytic threshold.
This intrinsic bottleneck is governed by the Arrhenius relationship; it can only be mitigated by lowering temperature (to reduce Q and Dint) and absolute humidity.
-
2
Surface Diffusion vs. External Removal (D → E)
Once AA reaches the surface, the focus shifts to the Mass Transfer Coefficient between the film and its environment.- If D > E: The boundary-layer partial pressure (PBL) rises, causing "vapor feedback" that re-acidifies the film.
- If E > D: AA is removed faster than it arrives, maintaining a steep gradient that "pulls" acid out of the film.
This is the domain of preservation engineering. The flux (J) from the film is defined by the partial-pressure gradient:
J ∝ (Pfilm − PBL)
J ∝ (PBL − Penv)Effective preservation keeps PBL ≈ Penv (via ventilation or molecular sieves), ensuring that the "exhaust" for the internal chemical reaction remains as open as possible.
In this document, the animation cel is treated as a composite object: a CTA substrate that generates and transports acetic acid, and a paint or ink stack that rides on top of that substrate. The paint layer does not have its own internal acid-generation term in this model; instead, it acts as a diffusion barrier and inherits its failure behavior from the condition of the CTA base. All functional requirements, functional failures, and failure modes defined below are therefore specified at the cel level, with paint stability captured through system-level functions such as visual fidelity and dimensional stability rather than a separate paint-only FR/FF/FM tree. A future refinement may introduce an explicit paint-domain model, but this first framework keeps chemistry centered on the CTA substrate that drives vinegar syndrome.
CTA has two acid buildup points:
(1) internal generation-to-diffusion (Q → D), which cannot be measured or directly controlled, and
(2) surface diffusion-to-removal (D → E), which can be engineered, validated, and monitored. Effective preservation focuses on slowing Q and ensuring E > D at the boundary layer.
The Animation-Cel Bathtub Curve
Reliability engineers love the “bathtub curve,” and it turns out animation cels aren’t that different from hardware. The figure below is a classic engineering bathtub curve for system/equipment failure rate over time.
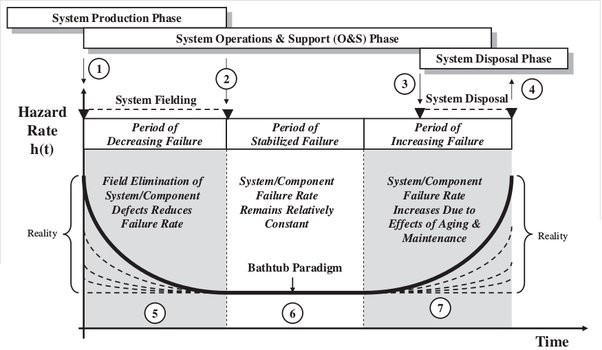
Here’s how each region of the bathtub curve maps directly to animation cels:
Early-Life Region – Period of Decreasing Failure Rate
Failure rate starts high and then drastically decreases. For animation cels, this corresponds to failures driven by factory and handling defects:
- paint adhesion or formulation issues from the studio
- variation in polymer quality, plasticizer content, or curing
- trapped moisture in the acetate during manufacture
- stuck layers from humid studio storage
- unstable dyes or paints that were marginal from day one
Storage today does not change this region — these are baked-in, “infant mortality” issues.
Mid-Life Plateau – Period of Stabilized Failure Rate
This is where most 1980s–2000s cels live right now. Hydrolysis is active but not yet catastrophic. Internal acidity is slowly climbing, paint is intact, and diffusion through the film is still reasonably fast. The key is: the slope here is almost entirely controlled by environment.
Your storage tier decides whether this plateau is gently sloped or quietly steep:
- Low Tier: Hot, humid, stagnant → steep slope → early onset of VS.
- Medium Tier: Reasonably controlled → “natural” slope → coasting.
- High Tier: Cold, dry, low-ppm → very shallow slope → life extension.
A useful way to interpret the mid-life plateau is stabilizer capacity. Many acetate formulations include stabilizers or scavenging capacity from manufacture. Early in life, this capacity buffers acidity rise; over time it is gradually consumed. Once stabilizer capacity approaches zero, internal acidity can rise faster and the cel transitions into a wear-out regime.
Preservation slows stabilizer depletion (by reducing Q and limiting moisture/heat),
but cannot regenerate stabilizer capacity once it is exhausted — which is why proactive tiers matter.
Wear-Out Region – Period of Increasing Failure Rate
Once internal acidity crosses a threshold, the cel enters a true wear-out regime:
- CTA modulus increases; the base film stiffens and shrinks.
- Paint experiences more mechanical stress and begins to crack or lift.
- Diffusion slows, so new acid is generated faster than it can escape.
- Boundary layers worsen; acetic acid is generated, trapped, and reabsorbed.
- Vinegar syndrome becomes self-accelerating and obvious to the collector.
This is analogous to aging and wear-out failures in hardware. Environment still matters — you can slow the slope —
but you’re now managing an already unstable system. Reset protocols are required if you want to move a cel back
toward a lower-acidity state.
Functional Requirements, Functional Failures, and Failure Modes
To apply reliability-centered thinking to animation cels, we have to be explicit about what it means for a cel to be “working” and what it means for it to have “failed.” In equipment reliability, we start with functional requirements, define functional failures, and then enumerate the failure modes that cause those failures. The same structure works cleanly for cels.
Framework Logic – From Functions to Preservation Spectrum
CTA Preservation Framework Logic Flow
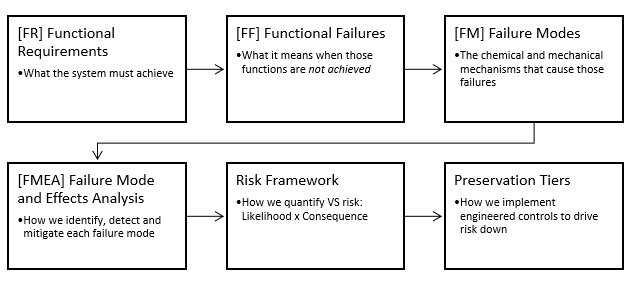
This logic flow shows how we move from system functions (what a storage or display environment must achieve), to functional failures (what it means when those functions are not met), to failure modes (the chemical and mechanical mechanisms), and finally into a structured FMEA and the risk framework. The resulting insights drive the Preservation Tiers, which are engineered environments that explicitly control the dominant failure modes to target specific likelihood and consequence bands.
The preservation framework follows a classic reliability-centered logic:
- FR – System Functions: define what a storage or display system must do for a cel (e.g., limit hydrolysis, avoid local acid build-up, prevent mechanical fatigue, avoid light damage).
- FF – Functional Failures: describe what it looks like when those functions are not met (e.g., “environment allows VS feedback,” “support geometry allows curl and blocking,” “display causes fading”).
- FM – Failure Modes: map each functional failure to a specific physical / chemical cause (FM1–FM7).
- FMEA: scores each FM for likelihood, consequence, and detection, and identifies the controls needed to keep that FM benign.
- Preservation spectrum & tiers: stack those controls into coherent environments (Tier 1–5) and ask whether the full set of FMs is controlled to the desired likelihood band over a ~50-year horizon.
In other words, the functions define what the system must achieve, the FMEA defines how it can fail, and the preservation tiers define how much engineering control is applied to keep those failures from occurring.
Functional Requirements (FRs)
For the purposes of preservation, an animation cel is expected to satisfy the following core functions:
- FR1 – Structural Integrity: the CTA base remains flexible, continuous, and not embrittled.
- FR2 – Chemical Stability: internal acidity remains low enough to avoid rapid, self-accelerating deterioration.
- FR3 – Visual Fidelity: paint remains adhered, legible, and reasonably close to original color and gloss.
- FR4 – Dimensional Stability: the cel stays flat enough to be safely handled and displayed (no severe cupping, rippling, or shrinkage).
- FR5 – Handling/Display Survivability: the cel tolerates normal archival handling, inspection, and display without damage.
These functional requirements are defined at the level of the cel as a whole. The paint layer is not given its own independent FR/FF/FM set in this first version of the framework; instead, paint behavior appears in FR3 (visual fidelity) and in the associated functional failures and failure modes. In other words, the CTA substrate drives the chemistry, and the paint layer expresses many of the consequences. A later, more detailed model may decompose paint-specific requirements separately once more data exist
In addition to the CTA polymer and paint layers, animation cels contain a mobile plasticizer system (e.g., triphenyl phosphate and phthalates) that is integral to both mechanical compliance and long-term visual behavior. Plasticizers do not directly generate acetic acid; however, their presence and gradual depletion influence polymer mobility, stress relaxation, diffusion behavior, and the expression of deformation. Plasticizer loss can indirectly impact visual fidelity (FR3) through increased curl, surface distortion, paint stress, and loss of gloss uniformity, even in the absence of severe chemical degradation.
In this first version of the framework, plasticizer behavior is treated as an internal modifier of CTA substrate performance rather than a standalone functional requirement. Its effects are therefore captured implicitly within FR1 (structural integrity), FR3 (visual fidelity), and FR4 (dimensional stability). Future revisions of the framework may elevate plasticizer state to an explicit modeled parameter once sufficient empirical data exist to support independent thresholds and verification criteria.
Functional Failures (FFs)
A functional failure occurs when one or more of those requirements is no longer met, even if the object is still physically present. In practice, collectors experience functional failures as:
- FF1 – Structural Failure: cracking, brittleness, tearing, or severe base instability.
- FF2 – Chemical Failure: active vinegar syndrome (strong odor, high acidity, rapidly advancing damage).
- FF3 – Visual Failure: obvious fading, chalking, haze, paint loss, or irreversible blocking.
- FF4 – Geometric Failure: strong cupping, shrinkage, rippling, or stuck/background-bonded layers.
- FF5 – Handling Failure: damage from normal handling, including creases, scratches, or paint lift.
Failure Modes (FMs)
With functions and failures defined, we can talk about the failure modes — the characteristic ways a cel drifts into those failure states. These are driven by the chemistry and physics we covered in the previous sections:
- FM1 – Intrinsic Hydrolytic Chain Scission (Normal Aging): the ever-present background hydrolysis of CTA that slowly lowers Degree of Polymerization and produces acetic acid, governed by temperature and absolute humidity. This is the “natural” aging mode and sets the pace for eventual FF2.
- FM2 – Autocatalytic Hydrolysis (Runaway VS): a secondary, accelerated mode that appears once internal acidity and local pH drop far enough that acid-catalyzed hydrolysis feeds itself. This mode rapidly drives FF1, FF2, FF3, and FF4.
- FM3 – Vapor-Phase Feedback / Emission Bottleneck: small, poorly vented volumes or blocked geometries that allow acetic acid to build up around the cel, reducing diffusion out of the film and recycling acid back into it. This mode amplifies FM2 and accelerates entry into the wear-out region.
- FM4 – UV-Induced Photooxidation: exposure to UV and high-energy visible light that degrades pigments and binders, driving FF3 independently of vinegar syndrome. UV acts as an accelerator on top of the chemical baseline.
- FM5 – RH Cycling and Dimensional Fatigue: repeated moisture-uptake and loss cycles that cause expansion and contraction of CTA and paint, leading to accumulated stress, curl, and distortion (FF4), especially later in life or when plasticizer levels are reduced.
- FM6 – Sustained Compression and Creep: long-duration static loading from stacking, tight framing, overfilled binders, gravity loading, or prolonged contact pressure that drives viscoelastic creep, thickness loss, set-in deformation, and optical distortion. This mode primarily affects dimensional stability (FF4) and visual fidelity (FF3), and is strongly time- and temperature-dependent.
- FM7 – Enclosure Contamination: acids, plasticizers, or solvents migrating from non-archival boards, foams, and plastics into the cel stack, accelerating FF2 and compounding FF3.
- FM8 – Mechanical Damage: one-off events such as creasing, compression shocks, frame over-tightening, drops, or rough handling that trigger FF5 (and sometimes FF3 or FF4 if layers stick, shear, or delaminate).
What we call a “preservation tier” is, in reliability language, really just a shorthand for
which failure modes are being controlled well, which are being controlled poorly, and which are being
actively accelerated.
From Failure Modes to FMEA
Once functions, failures, and modes are clear, we can step into a structured Failure Modes and Effects Analysis (FMEA) for cels. That’s where we assign severity, occurrence, and detectability rankings to each mode and deliberately decide which preservation controls are worth the effort.
The preservation tiers later in this article are essentially the “control strategies” flowing out of that FMEA: they show how different storage choices either mitigate or amplify specific failure modes.
Failure Modes (FMEA): How & Why Cels degrade
With the functional failures and failure modes on the table, we can lay out a high-level Failure Modes and Effects Analysis (FMEA). This isn’t meant to be a line-by-line lab worksheet; it’s a map of which physics dominate cel lifetime and how our storage choices interact with them.
The table links each failure mode (FM1–FM7) to:
- Primary Effect – what actually happens to the cel when this mode dominates.
- Failure Type – whether the mode is hidden, evident, predictable, or dormant in the RCM sense (can you see it early, or only after damage?).
- Detection – practical ways a collector or conservator can observe or infer that mode (AD strips, odor, RH logs, visual inspection, mass change, etc.).
- Key Controls – the environmental and design levers that keep that mode benign or push it into very low likelihood.
Later sections turn these controls into likelihood vectors for chemical and structural
aging, and then into preservation tiers. In other words, if a tier claims to be
“Tier 1,” it is really claiming that the key controls for all of these FMs are in place and,
where required, verified.
| # | Failure Mode | Primary Effect | Failure Type | Detection | Key Controls |
|---|---|---|---|---|---|
| FM1 | Intrinsic hydrolytic chain scission (normal aging) | Slow increase in internal acidity; long-term drift toward FF2. | Dormant / Predictable | AD strip drift (long horizon), pH estimation model, elevated emission baseline. | Temperature reduction, absolute humidity control, stable environments without extreme peaks. |
| FM2 | Autocatalytic hydrolysis (runaway VS) | Rapid onset of VS; warping, odor, severe structural/visual loss (FF1–FF4). | Hidden → Evident (late) | Sudden odor spike, strong AD strip response, rapid AD shift in sealed tests. | Limit internal acidity buildup, enable emission, add local scavengers, keep temperature and moisture low. |
| FM3 | Vapor-phase feedback / emission bottleneck | AA accumulates near the cel, decreasing net diffusion and increasing reabsorption. | Hidden | AD strip stays elevated despite “good” storage; scavenger mass uptake indicates boundary-layer load; gradients by strip location. | Engineered air paths, local sinks (scavengers), avoid tiny sealed volumes without sinks, avoid blocked geometries. |
| FM4 | UV-induced photooxidation | Color fading, binder oxidation, and pigment/binder damage driving long-term visual loss (FF3). | Evident (with lag) | Visual inspection, baseline photos under consistent lighting, color shift monitoring, spectro/colorimetry (optional). | UV-filtered glazing, remove direct light, limit high-intensity display duration, rotate display time. |
| FM5 | RH cycling / dimensional fatigue | Curling, cockling, shrinkage, and accumulated stress cracking (FF4), amplified by paint constraint and late-life embrittlement. | Hidden → Evident | Environmental trend logs (RH swings), geometric distortion trend, edge lift, seasonal drift signatures. | Buffer RH, avoid humidity swings, use microclimates, maintain stable temperature/RH, avoid repeated open-air exposure cycles. |
| FM6 | Sustained compression and creep (static load) | Long-duration loading from stacking, tight framing, overfilled binders, gravity loading, or prolonged contact pressure causing viscoelastic creep, set-in deformation, thickness loss, and optical distortion (FF4; often manifests as FF3). | Hidden → Evident (time-dependent) | Imprint/set patterns after storage, subtle plane deviation, texture/gloss change over months/years; deformation persists after “rest.” | Limit local pressure (P = F/A), avoid tight stacks, add intentional spacers/air gaps, store valuable cels near top, avoid clamping/ridge contact at paint islands, control dwell time. |
| FM7 | Enclosure contamination / material incompatibility | Added acid/solvent/plasticizer load accelerates FF2/FF3; can also increase sticking/blocking risk and local haze/film deposits. | Hidden | Localized AD strip spike, odor within enclosure, residue/haze, material pH tests, supplier specs, “new foam/plastic smell.” | Use archival-tested materials; avoid PVC/unknown foams; isolate questionable materials with barrier films; pre-condition/air-out components; keep scavengers away from direct contact surfaces. |
| FM8 | Event-based mechanical damage (handling / assembly / shock) | Creases, scratches, edge nicks, punctures, paint scuffs, clamp marks, or shear from mishandling (FF5; sometimes FF3/FF4 if layers stick or shear). | Evident (usually immediate) | Immediate visual inspection; compare before/after handling, reframing, or transport. | Rigid supports, safe sleeves, controlled handling procedure, avoid over-tight framing points, avoid sliding contact, use spacers and controlled clearances. |
FM6 covers slow geometric fatigue from RH cycling; FM7 covers time-dependent deformation from sustained load (creep/compression); FM9 covers discrete event-based handling/assembly damage. FM5 captures non-UV, plasticizer-mediated visual drift that can present as distortion or paint stress even without severe vinegar syndrome.
From FMEA to a Risk Framework
The FMEA tells us which failure modes exist and what controls keep each one benign. What it does not tell us is how these modes combine into an overall preservation risk. To move from a list of failure modes to a usable decision tool, we need a framework that separates two different questions:
- Likelihood: How fast will the cel move toward the effects of a given FM under the current environment?
- Consequence: If degradation progresses, how severe is the resulting loss?
This separation is essential. Some environments accelerate aging but do not immediately
change the cel’s condition (high likelihood, low current consequence). Others do little harm
chemically but allow mechanical damage to occur suddenly (low likelihood, high consequence).
Treating likelihood and consequence independently lets us apply the same analytic structure
used in aerospace and conservation engineering:
risk = f(likelihood, consequence).
The next section defines the likelihood and consequence scales and shows how each failure
mode contributes to them. These two axes form the backbone of the risk framework that the
preservation tiers are ultimately based on.
Degradation Progression – Chemical vs. Structural Tracks
With the FMEA complete and the risk framework defined, we now need to connect those failure modes to how degradation actually unfolds over time. Vinegar syndrome progresses along two interdependent tracks—a chemical lifetime track and a structural fatigue track—and each stage maps directly to the shared C₁–C₅ consequence scale. This progression is what anchors the later methodology for assigning likelihood (L) and consequence (C) in real-world storage environments.
| Stage | Chemical Lifetime Track (Lchem) |
Structural / Mechanical Track (Lstruct) |
Typical FMs / Consequences |
|---|---|---|---|
| 1 — Stable |
Lchem: 1 (Very Low) CTA near original condition; internal acidity at baseline. Hydrolysis generation rate (Q) is very low and diffusion easily keeps pace. No detectable odor; AD strips remain blue. |
Lstruct: 1 (Very Low) Minimal RH cycling; film flat and compliant with no observable curl, cockle, or strain patterns. |
Dominant FM: FM1 (normal aging). Consequence: C1–C2 (cosmetic or negligible in a 50-year horizon). |
| 2 — Early Drift |
Lchem: 2 (Low) Hydrolysis begins to outpace baseline; Q increases with temperature and absolute humidity. Internal pH slowly declines. Odor may be faint or intermittent. |
Lstruct: 2 (Low) Early fatigue from repetitive RH swings produces micro-strain, but geometry remains visually normal. |
FMs: FM1 with emerging FM5. Typical consequence: C2 (early chemical risk; mild structural impact). |
| 3 — Early VS / Dimensional Instability |
Lchem: 3 (Neutral) Detectable acetic acid odor; AD strips shift from blue toward green. Boundary layers can accumulate acid when emission (E) is weaker than generation (Q). VS onset is now measurable. |
Lstruct: 3 (Neutral) Noticeable curl or cockling, especially under cycling or uneven moisture exposure. |
FMs: FM1, FM3 (vapor feedback), FM5. Consequence: C2–C3 (visible degradation; early-stage reversible). |
| 4 — Runaway & Structural Stress |
Lchem: 4 (High) Autocatalytic VS: Q » internal diffusion. Acid accumulates in the film faster than it can migrate out. Poor ventilation or a saturated cavity accelerates internal breakdown. |
Lstruct: 4 (High) Strong curl, shrinkage, blocking, paint instability, and cracking as mechanical strain exceeds the film’s tolerance. |
FMs: FM2 (runaway VS), FM3, FM4/FF3 (UV-linked), FM5, FM7. Consequence: C3–C4 (major loss of function and appearance). |
| 5 — End-of-Life |
Lchem: 5 (Very High) Polymer is heavily deacetylated; internal acidity remains high even with strong vapor control. Chemical stability cannot be restored. |
Lstruct: 5 (Very High) Film embrittlement, cracking, paint detachment, and possible image loss. Handling causes further damage. |
FMs: FM2, FM4, FM7 dominate. Consequence: C4–C5 (severe / near-total loss). |
In design terms, preservation work aims to keep the cel in Stage 1–2 for as long as possible by reducing chemical likelihood (lowering Q, maintaining a strong emission gradient E) and avoiding structural cycling that increases fatigue. When we assign a tier, we can now say both “this environment keeps the chemical track in Lchem ≈ 1–2” and “it limits structural loading to Lstruct ≈ 1–2,” and then read the resulting consequence vector directly from the shared C1–C5 scale.
Risk Framework
In the sections above we defined the functional requirements of a preservation system, the functional failures, the chemical and mechanical failure modes, and the shared consequence scale (C1–C5). We also mapped how degradation progresses across two tracks: a chemical lifetime track and a structural fatigue track. With these foundations in place, we can now define what risk means for animation cels.
Risk = Likelihood (L) × Consequence (C)
The likelihood component reflects how strongly an environment accelerates the relevant
failure modes—primarily hydrolysis (VS) and structural fatigue—based on temperature,
absolute humidity, handling, diffusion geometry, and microenvironment behavior. The
consequence component reflects how far along the degradation progression a cel could
move if exposed to that stress. This gives a traceable and physically grounded way to
compare different storage and display environments: not by opinion, but by the physics
driving chemical and mechanical deterioration.
5. Risk Scoring Logic – From Failure Modes to Tiered Risk
Risk Framework Logic Flow
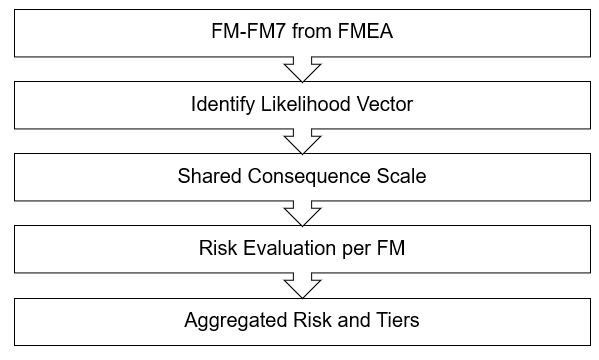
The framework evaluates a unified set of failure modes (FM1–FM8) across three independent likelihood vectors: chemical, structural, and UV/light. Each vector uses the same L1–L5 ladder, and all three map into the shared C1–C5 consequence scale.
- Lchem — chemically driven progression (temperature, absolute humidity, acid feedback, diffusion geometry);
- Lstruct — mechanically driven progression (RH cycling amplitude, dimensional fatigue, handling stress, enclosure mechanics);
- Luv — UV/photooxidative progression (UV dose, spectrum, display duration);
- C — resulting consequence for that FM (shared C1–C5 ladder).
Although all vectors use the same scale, the chemical vector is treated differently:
Lchem is not subjectively assigned. It is calculated from
Arrhenius temperature dependence, absolute humidity thresholds,
and feedback accelerants such as boundary-layer stagnation. The derivation is
detailed in the Appendices and forms the backbone of the Risk calculators.
The structural and UV vectors remain qualitative because their dominant
drivers (RH cycling and UV dose) currently lack validated quantitative lifetime models.
Maintaining a unified consequence ladder allows all three vectors to combine coherently.
Rather than collapsing these independent drivers into a single universal likelihood, the framework evaluates likelihood on a per–failure-mode basis. Each failure mode is governed by one or more dominant physical vectors (chemical, structural, or UV), and only those applicable vectors are used when assessing likelihood for that mode.
For each failure mode FMi, likelihood is therefore defined as:
LFMi = max( Lchem,i, Lstruct,i, Luv,i )
where the maximum is taken only over the vectors that physically drive that failure mode. For example, UV exposure is irrelevant to compression creep, and structural loading is irrelevant to intrinsic hydrolysis. This avoids artificial averaging between unrelated mechanisms and ensures the dominant driver governs the assessed risk.
Risk for each failure mode is then expressed as:
RiskFMi = LFMi × CFMi
The framework output is therefore a ranked risk register (FM1–FM8), rather than a single blended score. This reflects the physical reality that different environments tend to fail cels in different ways, and that preservation decisions should prioritize the failure mode most likely to dominate near-term or long-term survivability.
Important Rules and Clarifications
1. Dominant Vector Rule
For each failure mode, likelihood is governed by its dominant physical driver.
Increasing control of non-dominant vectors cannot compensate for poor control
of the dominant one. For example, excellent UV protection does not mitigate
sustained compression creep, and stable geometry does not mitigate runaway
autocatalytic hydrolysis.
2. Chemistry Priority Clarification
Chemical degradation in acetate is unavoidable unless actively suppressed
through temperature and moisture control. As a result, chemical likelihood
dominates FM1–FM3 and strongly influences long-term survivability even when
structural and UV stresses are low. Structural and UV-driven failure modes,
by contrast, are contingent on handling, display choices, and enclosure design.
3. Dark-Storage Interpretation
In environments where UV exposure is negligible, Luv is not
considered for any failure mode. This does not reduce conservatism; it simply
reflects that UV-driven mechanisms are inactive in dark storage and should not
be allowed to dilute assessment of chemical or structural risk.
The preservation tiers then combine these vector-level results into a multi-vector risk profile.
Tier 1 environments keep all vectors in low-likelihood, low-consequence bands. Higher tiers permit one or more
vectors to rise into moderate or high risk. Using the shared consequence scale ensures that chemical,
structural, and UV pathways remain directly comparable across all scenarios.
1. Functional Failures & Risk Vector Groups
We retain the same functional failures (FFs) defined in the main RCM framework. These represent the observable end states that matter from a preservation and usability standpoint:
- FF1 – Structural failure: base film embrittlement, cracking, tearing.
- FF2 – Chemical failure: active vinegar syndrome; high internal acidity and strong odor.
- FF3 – Visual failure: paint loss, blocking, haze, gloss nonuniformity, or surface damage.
- FF4 – Geometric failure: cupping, rippling, shrinkage, set-in deformation, stuck stacks.
The detailed failure modes from the FMEA do not contribute equally to every type of risk.
Instead, they cluster into a small number of dominant physical risk vectors,
each governed by different inputs and control strategies. These vectors are used to
evaluate likelihood per failure mode, not to produce a single blended score.
| Risk Vector Group | Included Failure Modes (FM) | Primarily Drives | Dominant Inputs |
|---|---|---|---|
| Chemical / VS Progression |
FM1 – intrinsic hydrolysis (normal aging); FM2 – autocatalytic hydrolysis (runaway VS); FM3 – vapor-phase feedback / emission bottleneck |
FF2 (chemical), FF4 (geometric); indirectly FF1 / FF3 at late stages |
Temperature, absolute humidity, internal acidity, diffusion geometry, boundary-layer behavior |
| Photochemical / Light Exposure | FM4 – UV-induced photooxidation | FF3 (visual) | UV dose, spectrum, intensity, cumulative display duration |
| Structural / Mechanical Evolution |
FM5 – RH cycling and dimensional fatigue; FM6 – sustained compression and creep; FM7 – enclosure contamination / material incompatibility; FM8 – event-based mechanical damage |
FF4 (geometric), FF3 (visual), FF1 (structural) | RH cycling amplitude, static load and dwell time, plasticizer state, enclosure mechanics, handling and assembly practices |
In later tools and calculators, environments are therefore described using a vectorized risk profile (e.g., chemical risk, structural risk, UV risk), rather than a single “good/bad” score. Preservation decisions prioritize the dominant failure mode for a given storage or display configuration.
2. Consequence Scale (C) – How Bad Is the Outcome?
Consequence answers: “If this vector drives a failure, how bad is it for the cel?” This is tied to the functional failures above and is used consistently across environments and vectors.
| C Score | Impact Description | Examples in Cels |
|---|---|---|
| 1 – Cosmetic | Slight change, no real loss of function or life expectancy. | Light board scuffs, tiny sleeve marks, mat burn on a non-image border. |
| 2 – Local | Localized damage; noticeable to you but cel still broadly stable. | Small area of stuck paint, minor curl that relaxes in storage, slight localized haze. |
| 3 – Significant | Noticeable loss of function/aesthetics; intervention recommended. | Moderate vinegar odor, visible cockling, early blocking, paint lift in important areas. |
| 4 – Major | Large impact on one or more functions; remaining life substantially shortened. | Strong VS with warping, widespread blocking, major shrinkage or repeated stuck-layer separation. |
| 5 – Critical | System-level failure; the cel is chemically unstable in normal storage and functionally at end-of-life. Deacetylation cannot be reversed, but in a professional context the image may still be stabilised by moving to deep-frozen storage (e.g. < -20 °C). | Severe VS, strong vinegar odor, brittle and warped base, blocking/sticking between layers, widespread paint loss or cracking through the image. In collector settings this is effectively “total loss”; in an institutional freezer it may be held in a “no further loss, but not restored” state. |
This consequence scale applies across all degradation vectors.
For any environment we can score chemical and mechanical outcomes
separately using the same C1–C5 ladder. When we later show a
“consequence vector” such as (C₂, C₃), it simply means:
C₂ for the chemical lifetime track and C₃ for the
structural/mechanical track, both using this shared scale.
3. Environment-Relative Likelihood (L) by Vector
Likelihood is always scored relative to the 70 °F / 50% RH baseline over a 50-year horizon. Each vector gets its own L-scale because they respond differently to the same environment.
3.1 VS Chemistry Vector (FM1 + FM3 Drivers) – Lchem,env
This captures the inherent aggressiveness of the storage environment for a stable CTA cel. It is highly sensitive to temperature and absolute humidity, and it is adjusted for microenvironment behavior (vapor paths, stagnant sealing, scavengers).
FM2 (runaway) is treated separately. Autocatalytic acceleration is a threshold- and state-dependent behavior. Once internal acidity is elevated, the same environment can behave very differently. We score the likelihood of entering runaway as LVS,run using observable indicators (AD / ppm band, odor, early warping, diffusion traps).
| LVS | VS Progression vs Baseline (50 yrs) | Heuristic |
|---|---|---|
| 1 – Very Low | Much slower than baseline; VS onset effectively beyond 50 yrs for stable cels. | Deep-cold, buffered microclimate; AD strips stay blue; reset cels remain stable when managed correctly. |
| 2 – Low | Slower than baseline; VS still possible but clearly delayed on a 50-year horizon. | Cool, dry rooms or mild cold storage with controlled RH. |
| 3 – Neutral | Comparable to baseline institutional storage. | 70 °F / 50% RH, modest RH swings, no microclimates. |
| 4 – High | Faster than baseline; clear VS progression expected within 50 yrs. | Warm, humid, or RH-cycling environments; poor vapor paths; no scavengers. |
| 5 – Very High | Much faster than baseline; obvious VS on 5–15 yr timescales. | Hot + humid storage (attic / garage / unit) or sealed, unbuffered boxes in those spaces. |
Note on independence of L and C.
Although a severely degraded cel (high C) can influence its own
microenvironment (for example by releasing more acid or trapping vapor in warped
geometry), the L-scale in this framework is defined as the
inherent aggressiveness of the environment itself. Keeping L independent
of C makes tiers comparable between collectors and allows us to specify
environments in a clear, testable way.
Any state-driven feedback (autocatalytic VS, diffusion bottlenecks, reduced scavenger effectiveness, etc.) is handled via correction factors in the VS likelihood methodology in Appendix A, not by changing the L-table. In other words, the environment sets the base L; the cel’s condition and feedback effects are accounted for when we adjust that base L and then combine it with C in Risk = L × C.
3.2 VS Runaway Threshold (FM2) – LVS,run
FM2 represents the regime shift where vinegar syndrome becomes self-accelerating (autocatalytic behavior). Unlike Lchem,env, which is environment-defined, LVS,run is conditional: it depends on both the environment and the cel’s current acidity state (starting condition).
This table is intentionally semi-quantitative. Most collectors do not know exposure dose or UV flux, and most do not have lab-grade acidity measurements. The goal is consistent scoring using signals you can actually observe.
3.3 UV / Light Vector (FM4) – LUV
UV risk is driven by dose × time, not humidity. So we anchor its scale to display behavior.
| LUV | Relative UV Risk (50 yrs) | Typical Pattern |
|---|---|---|
| 1 – Very Low | Essentially dark storage; UV events are rare and filtered. | Stored in the dark; brief viewing under low-intensity, UV-filtered light. |
| 2 – Low | Mostly dark with short, controlled display windows. | Framed but displayed a few weeks per year; UV glass; away from windows. |
| 3 – Neutral | Routine indoor lighting without direct sun. | Wall display in a typical room; no UV glass but also no strong sunlight beam. |
| 4 – High | Frequent bright display and/or partial sun exposure. | Near windows, spotlighted gallery lighting for long periods. |
| 5 – Very High | Direct or near-direct sun repeatedly hits the art. | In front of unfiltered windows; strong daylight across the piece for hours per day. |
3.4 RH Cycling and Dimensional Fatigue (FM5)
FM5 covers accumulated deformation from repeated moisture uptake and loss cycles (expansion/contraction of acetate and paint). It is structurally dominated and maps heavily into FF4 (geometric) and sometimes FF3 (visual).
| Lstruct | Relative Structural / Mechanical Risk (50 yrs) | Examples (handling + RH cycling) |
|---|---|---|
| 1 – Very Low | RH cycling **ΔRH < 5%** per typical cycle (much tighter than a good room). | Microclimate buffered so the effective aw band is extremely narrow (e.g., engineered cold box, well-buffered small volumes). |
| 2 – Low | RH cycling **5% ≤ ΔRH ≤ ~10%**, slightly better than or equal to a best-case room. | Room or microclimate held near a stable setpoint with modest drift, generally as good as (or a bit tighter than) a well-behaved 70 °F / 50 % room. |
| 3 – Neutral | RH cycling **≈10–12%** per typical cycle (our reference case). | RH swings equivalent to a typical interior room drifting **67–73 °F** around 70 °F with constant AH, giving an aw band of roughly 0.47–0.54 (~47–54% RH equivalent). No extremes, but no deliberate buffering either. |
| 4 – High | RH cycling **~12–20%**, but still without sustained condensation. | Environment has large day–night RH shifts, seasonal spikes, or repeated excursions above ~60% or below ~30% RH, yet does not routinely hit saturation. |
| 5 – Very High | RH cycling **> 20%**, including condensation or very low RH episodes. | Environments that push aw toward 1.0 (condensation, damp basements) or toward very low values for long periods, combined with strong repeated T/RH shocks (fridge-box cycling, attic or garage extremes). |
3.5 Sustained Compression and Creep, Static Load (FM6)
FM6 covers time-dependent deformation under sustained load: stacking weight, tight frames, overfilled binders, clamp points, gravity loading, and prolonged contact pressure. This is structurally dominated and strongly dependent on dwell time and temperature.
| Lstruct,comp | Pressure / Dwell Interpretation |
|---|---|
| 1 — Very Low | Green zone: P ≤ 2 psi at contact features, or effectively near-zero contact (large flat area, strong spacers, or no stacking). Multi-year dwell is unlikely to imprint or deform paint. |
| 2 — Low | Low Yellow: 2 < P ≤ 3 psi. Generally safe, but cumulative risk exists for thick or soft paint, or chemically weakened (VS-active) cels under long dwell. |
| 3 — Neutral | Upper Yellow: 3 < P ≤ 5 psi. Time-dependent risk band. Multi-month to multi-year dwell can contribute to subtle flattening, blocking patterns, or texture transfer. |
| 4 — High | Red onset: 5 < P ≤ 7 psi. Not instant failure, but undesirable as a long-term resting load, especially for raised linework, heavy paint islands, or any cel with active VS or surface stickiness. |
| 5 — Very High | Deep Red: P > 7 psi and/or repeated long dwell under load. High likelihood of permanent deformation or imprinting within years (or sooner if paint is softened). |
3.6 Enclosure Contamination / Material Incompatibility (FM7)
FM7 captures chemical loading introduced by the enclosure itself: acids, solvents, plasticizers, or reactive volatiles emitted from boards, foams, adhesives, plastics, or coatings. This failure mode is typically chemically dominant, acting as a source term that elevates local acidity, interferes with emission or scavenging, and accelerates other chemical or mechanical failure modes.| Likelihood | Enclosure Condition | Interpretation |
|---|---|---|
| Unlikely | All enclosure materials are known-compatible or tested archival (e.g., PET/Mylar, inert plastics, buffered boards, metals, glass). | The enclosure does not contribute meaningful chemical loading. FM7 can be neglected as a primary risk driver. |
| Likely | One or more enclosure components are chemically active, untested, or known-incompatible (e.g., PVC, rubber foams, unknown plastics, pressure-sensitive adhesives, acidic boards). | The enclosure is a probable source of volatile acidity or solvent load. FM7 should be treated as an active chemical risk contributor. |
FM7 is scored categorically rather than on a continuous scale. If incompatible or unverified enclosure materials are present, treat FM7 as Likely. If all materials are known-compatible or tested archival, treat FM7 as Unlikely.
FM7 does not receive its own numeric L-score. Instead, it acts as a modifier to chemical and mechanical likelihoods (e.g., elevating Lchem or accelerating FM8 when present).
3.7 Event-based Mechanical Damage (FM8)
FM8 covers time-dependent deformation under sustained load: stacking weight, tight frames, overfilled binders, clamp points, gravity loading, and prolonged contact pressure. This is structurally dominated and strongly dependent on dwell time and temperature.
| Lstruct | Relative Structural / Mechanical Risk (50 yrs) | Examples (handling + RH cycling) |
|---|---|---|
| 1 – Very Low | Rigid, gentle support with tight RH control. | Rigid backing, oversized sleeves, no stack compression; archival handling only a few times per year. |
| 2 – Low | Occasional handling with good supports and **mild RH cycling**. | Binder or box with careful page turning; frame not over-tightened. |
| 3 – Neutral | Regular handling or mediocre support. | Loose binders, soft backing; occasional frame flex; guests handling frames. |
| 4 – High | Frequent handling or poor support. | Thin sleeves, tight portfolios, frame points digging into stacks, frequent reframing. |
| 5 – Very High | Sustained physical stress, bending, weight. | Cels stored loose; stacks under weight; rolled or folded; frames acting like clamps. |
4. How Vectors Map Back to Functional Failures
To keep things traceable, we explicitly link each vector to the FFs it mostly affects:
| Risk Vector (Likelihood) | Included FMs | Primarily Drives | Dominant Inputs |
|---|---|---|---|
| VS Chemistry Lchem |
FM1 — intrinsic hydrolysis (normal aging) FM2 — autocatalytic hydrolysis (runaway VS) FM3 — vapor-phase feedback / emission bottleneck |
FF2 (chemical), FF4 (geometric) → eventually FF1/FF3 | Temperature, absolute humidity, vapor-phase acetic acid, enclosure diffusion/venting geometry, scavenger presence & placement |
| UV / Light Luv |
FM4 — UV / photooxidation | FF3 (visual) | UV dose, high-energy visible, glazing/filtering, display duration, distance to light |
| RH Cycling / Bending Lstruct,geom |
FM5 — RH cycling / dimensional fatigue | FF4 (geometric), FF1 (structural) | RH swing magnitude & frequency, support rigidity/flatness, sleeve fit, frame/binder geometry |
| Compression / Contact Pressure Lstruct,comp |
FM6 — compression / creep (time-dependent) | FF3 (surface/paint), sometimes FF4 (blocking/adhesion patterns) | Local pressure (P = F/A) at paint ridges/islands, dwell time, stack configuration, interleaving/spacers |
| Material Compatibility Lmatl |
FM7 — enclosure contamination | FF2/FF3 (chemical acceleration + visual/paint impacts) | Material chemistry (PVC/plasticizers, rubber sulfur, wood acids), adhesives/inks, VOC load, sealing, proximity/contact |
| Handling / Accidents Lstruct,event |
FM8 — mechanical damage (event-based) | FF1 / FF3 (scratches, creases, tears, paint loss) | Handling frequency, procedure discipline, workspace, pets/kids risk, transport, reframing frequency |
The intent is: for any storage setup, you can score each vector independently (Lchem, Luv, Lstruct,geom, Lstruct,event, Lstruct,comp, Lmatl) and pair each with the shared consequence scale (C1–C5).
Example – Same Cel, Different Environments, Different Risk
To see how the framework works in practice, consider a cel that currently reads blue–green on an AD strip (roughly Level 0.5–1). In the progression model, this corresponds to early chemical drift – some acid is present, but the cel is not yet in an autocatalytic runaway regime. On the shared consequence ladder, we can treat this as C = 2 (early VS exposure, no structural distortion).
We keep this starting condition fixed and compare two storage environments. The cel,
its AD reading, and its present-day consequence level C = 2 do not change.
What changes is the likelihood vectors (Lchem, Lstruct, Luv)
that push the cel forward along each lifetime track.
Overall likelihood is computed as:
Leff = 0.50·Lchem + 0.25·Lstruct + 0.25·Luv
Chemical progression dominates long-term CTA decay, so it receives double weight.
Environment A — Stable Room (Approx. Tier 3)
- ~70 °F with daily drift ±2–3 °F
- RH averages ~50 % with excursions toward 60 %
- No scavenger; free emission into a large room volume
- Indoor ambient light, but not direct sun
Chemical (Lchem): Arrhenius inputs are relatively high. Hydrolysis remains active at
room temperature. This yields:
Lchem(A) = 3
Structural (Lstruct): Although temperature cycling is similar
to a typical 70 °F interior room (±3 °F), this environment also sees
RH excursions toward 60 %. That pushes the moisture cycling
well beyond the neutral “T-only” fatigue band (≈10–12 % RH swing) and into the
range where dimensional stress accumulates measurably over time.
Handling remains ordinary but the RH behavior dominates the score.
Lstruct(A) = 4
(RH delta exceeds baseline; moisture variability beyond the neutral band)
UV (Luv): Ordinary indoor lighting with no focused display. No direct UV load.
Luv(A) = 2
Combined likelihood:
Leff(A) = 0.50·3 + 0.25·4 + 0.25·2 = = 3
C = 2 (fixed starting condition)
Environment B — Controlled Cold Box (Tier 1 Conditions)
- ~42–48 °F, drift ≤ 1 °F
- Buffered absolute humidity (Art Sorb); no condensation
- Pre-conditioned scavenger acting as a one-way sink
- No cycling, static microclimate; minimal handling
- Fully dark environment except brief access
Chemical (Lchem): Low temperature plus buffered aw and a sink push chemical
progression to the lowest band:
Lchem(B) = 1
Structural (Lstruct): Very tight RH cycling (<5 % equivalent), static mechanics,
no handling. This meets the “very low” band:
Lstruct(B) = 1
UV (Luv): Box is dark by design; UV dose is effectively zero:
Luv(B) = 1
Combined likelihood:
Leff(B) = 0.50·1 + 0.25·1 + 0.25·1 = 1
C = 2 (same starting condition)
Risk Matrix – L × C Score Bands
| C = 1 | C = 2 | C = 3 | C = 4 | C = 5 | |
|---|---|---|---|---|---|
| L = 1 | 1 | 2 | 3 | 4 | 5 |
| L = 2 | 2 | 4 | 6 | 8 | 10 |
| L = 3 | 3 | 6 | 9 | 12 | 15 |
| L = 4 | 4 | 8 | 12 | 16 | 20 |
| L = 5 | 5 | 10 | 15 | 20 | 25 |
Reading the matrix: scores near 1 (bottom-left) represent very low risk over a collector-relevant horizon; scores near 25 (top-right) represent environments where both the likelihood of VS progression and the consequence of that progression are severe.
Risk Comparison – All Vectors Included
| Environment | Lchem | Lstruct | Luv | Leff | C (today) | Risk = Leff × C |
|---|---|---|---|---|---|---|
| A – Stable Room (Tier 3) | 3 | 3 | 2 | 3 | 2 | 6 |
| B – Cold Box (Tier 1) | 1 | 1 | 1 | 1 | 2 | 2 |
Same cel. Same starting condition (C = 2). One environment gives a combined likelihood near 3; the other drives it down to 1. Over a 50-year horizon, the first is roughly 3× more likely to push the cel along the VS track.
In this example, the AD level defines the starting consequence only. Likelihood — especially Lchem — is defined by the quantitative VS method in Appendix A.
From Risk Framework to Preservation Tiers
Once likelihood and consequence are defined, we can evaluate any storage environment in terms of how aggressively it drives degradation and how vulnerable the cel is to that degradation. But collectors still need a practical way to answer a simpler, actionable question:
“Given this environment, what level of engineering control am I actually achieving?”
This is where the preservation tiers come in. The tiers translate the risk framework into clear engineering categories by asking:
- Which failure modes are controlled? (derived directly from the FMEA)
- Which controls are actually implemented? (temperature, absolute humidity, diffusion access, scavengers, RH stability, geometry)
- Which controls are verified? (AD strips, sensors, test data, diffusion checks, 0 ppm validation)
- What likelihood band does the environment fall into? (slow vs. fast aging)
In other words, tiers are not opinions about storage quality. Each tier represents a specific, increasingly stringent set of controls that suppress the relevant failure modes:
- Tier 5–4: Little or no control; multiple FMs remain active.
- Tier 3: Basic environmental control, but no strong mitigation of chemical drivers.
- Tier 2: Engineered cool storage with controls in place for both chemical and structural vectors.
- Tier 1–0: Same core controls as Tier 2, but with tighter margins and more stringent verification (logging, capacity checks, documented performance).
Tiers 0–2 represent engineering mandates, not just likelihood categories. These tiers are defined by measurable environmental controls rather than subjective scoring:
- Vault Storage (Tier 0) – Deep Cold Institutional Storage: Film-vault style environments with deep cold, tight RH control, and verification suitable for long-term institutional retention.
- Tier 1 – Engineered Archival Cold: Cold storage with measured RH stability, sized scavenger capacity, and documented microenvironment performance.
- Tier 2 – Cool, Controlled Storage: Cooler than room with bounded RH and cycling, suppressing major chemical and mechanical FMs. The configuration is still intentionally engineered; verification and logging may be lighter-weight than the deep archival expectations in Tiers 1/0.
This distinction separates a simple “cold room” or cabinet from a verified, high-performance archival microenvironment.
The preservation tier table that follows is effectively a control specification built from the FMEA and risk framework. If an environment claims to be Vault Storage, 1, or 2, it is really claiming that the controls for all major failure modes are satisfied—and that the measured likelihood of degradation matches the expected band.
The next section defines each tier in detail and shows how typical storage setups— binders, frames, cold boxes, reset containers, and open shelving—map onto them.
| Tier | T – Temperature (with typical Lbase) |
aw – Moisture / RH | M – Mechanical / Cycling | U – Light / UV |
|---|---|---|---|---|
| Vault Storage (Static Institutional) |
Deep cold, tightly bounded. Target ~40–52°F. Typical krel < 0.25 → Hydrolysis slowed >4× vs Room. |
Buffered aw (45–50% RH). Mandatory moisture buffer required. High risk of paint embrittlement if RH drops below 30% in this range. |
Static mechanics. Zero handling permitted. Paint is in a "glassy" state; any flex, vibration, or rapid thermal shift is a fracture risk. aw swings per cycle are held to ≲ 5 % RH. |
Dark Storage. Stored dark by default. Not intended for active viewing or hobbyist access. |
| Tier 1 Engineered archival cold |
Cold, tightly bounded. Target ~53–60 °F, daily drift ≤ ±1 °F with logging, no warm excursions. Typical krel ≲ 0.5 → Lbase in the ~2–4× band versus 70 °F / 50 %. |
Buffered aw (45–50% RH). Moisture acts as a critical plasticizer here to keep the paint above its glass transition temperature. |
Static mechanics. No compressor/defrost cycling; minimal handling; no repeated thermal or RH shocks. aw swings per cycle are held to ≲ 5 % RH. |
Dark or well protected. Stored dark by default. Any viewing uses UV-filtered glazing/sleeves. |
| Tier 2 Cool, controlled room / cabinet |
Cool, modest-drift. Approx. 61–67 °F with modest daily swings (≈ ±2–3 °F); not tied to fridge-style compressor cycling, not near heaters or hot exterior walls. Typical krel ≈ 0.5–0.9 → Lbase in the ~1.1–2× band versus 70 °F / 50 %. |
Buffered aw. RH held in a safe mid-band at operating T (approx. 45–55 %) with explicit buffering (e.g., Art Sorb). Saturation and very low RH are both avoided. |
Gentle cycling (6–10 % RH swing). HVAC-style drift and slow seasonal changes; aw swings per cycle are bounded to roughly 6–10 %, with no hard hot–cold or wet–dry cycling. Handling is careful and infrequent. |
Light managed. Not displayed in direct sun; occasional display behind UV-filter glazing or in low light. |
| Tier 3 Stable room preservation |
Good interior room. Approx. 68–72 °F with modest daily swings (≈ ±2–3 °F); away from radiators, attics, or exterior hot spots. Typical krel ≈ 0.9–1.1 → Lbase ≈ 1× (neutral vs 70 °F / 50 %). |
Moderate RH, limited excursions. Average roughly 40–55 %, with only occasional, short excursions outside this band. No sustained damp (>60 %) or very dry (<30 %) periods. |
Normal household cycling (~≤ 10–12 % RH swing). Ordinary HVAC cycling and seasonal drift; aw swings are comparable to a good 70 °F / 50 % room, with no deliberate rapid cycling or repeated condensation events. |
Light managed, not engineered. Not parked in window light or under strong spots; normal indoor lighting for storage, occasional display. |
| Tier 4 Unbuffered / uncontrolled |
Warm or variable. Frequently > 72 °F or subject to large daily swings (garage, attic, near exterior walls, poorly controlled rooms). Typical krel ≳ 1.1 → Lbase < 1× (accelerated decay). |
Humid or swinging RH. Regular episodes above ~60 % or below ~30 % with no buffering or logging. Seasonal dampness or pronounced dry periods are common. |
Unmanaged cycling (> ~10–12 % RH swing). Strong day–night temperature changes, intermittent dampness, space heaters, open windows, etc. aw swings often exceed the ~10–12 % RH band of a controlled 70 / 50 room. |
UV risk likely. Some exposure to daylight or bright artificial sources without UV mitigation (e.g., near windows, under bright LEDs). |
| Tier 5 High-risk / damaging |
Hot or extreme. Prolonged high temperatures (hot attics, cars, near heaters) or repeated extremes (e.g., 60 °F → 90 °F cycles). Typical krel ≫ 1 → Lbase ≪ 1× (VS strongly accelerated). |
Saturated or condensing. Conditions that drive aw → 1.0 or cause repeated condensation and drying (e.g., sealed box dropped into a fridge, damp basements, leaks). |
Severe mechanical stress (large RH and T shocks). Fridge/freezer cycling, direct HVAC blasts, frequent hot–cold swings or wet–dry pulses that drive aw swings well beyond ~15–20 % and cause warping, blocking, and delamination. |
Unsafe light exposure. Direct sun, backlit display, strong spotlights, or long-term display with no UV or intensity limits. |
How to read this table: These tiers describe the physical environment only (T, aw, cycling, and light). For a given tier, the temperature band maps to a typical chemistry-only likelihood band Lbase via krel. The final VS likelihood Lchem may be higher or lower than Lbase if microenvironment factors (sealed boxes, boundary-layer stagnation, scavengers, etc.) accelerate or mitigate acid generation and feedback, as defined in Appendix A.
How the Preservation Tiers Are Calculated (Click to Expand)
Tier 3 is not arbitrary—it reflects the long-established archival baseline of 70 °F and 50% RH, which is the condition used across film-preservation literature, including IPI research, when reporting earliest vinegar syndrome onset. This becomes the “1× life factor” reference point for all other tiers.
Temperature tiers (Lchem / Lbase) are derived from Arrhenius life-factor calculations using CTA hydrolysis activation energy (~105 kJ/mol). Life factors are grouped as:
- Tier 0: L > 4× (deep cold institutional storage).
- Tier 1: L ≈ 2–4× (engineered archival cold).
- Tier 2: L >1× but <2× (cool, controlled home or cabinet storage).
- Tier 3: L ≈ 1× (archival baseline at 70 °F / 50% RH).
- Tier 4–5: L < 1× (accelerated decay relative to baseline).
Tiers 0–2 are, by definition, engineered systems. Achieving meaningful life extension requires controlled temperature, controlled RH, sealed microenvironments, acid-absorption design, and sensing or verification appropriate to the tier. Even Tier 3—the archival baseline—requires a managed environment with basic stability and detection. Tier 4 is where most collectors naturally live, since open-air rooms, consumer frames, Itoyas, and sleeves do not provide engineered environmental control.
Tier 1 and Tier 0 are not practical targets for typical display products. They represent deep-storage preservation—tight RH control and cold temperatures suitable for long-term archival housing, not everyday home display. Preservation products developed under this framework therefore aim for Tier 2 engineered environments with life factors in roughly the 1.3–2× band while operating in a safe, moderate temperature range appropriate for display.
Water-activity (aw) criteria reflect the minimum moisture availability required for CTA hydrolysis. Because absolute humidity decreases with temperature, colder environments naturally move into lower-reactivity tiers even at the same RH. The lower bound is limited by CTA and paint stability, and ongoing material testing will refine this boundary.
UV tiers remain qualitative, as its risk is best managed through simple avoidance rather than detailed modeling. The scoring simply reflects relative exposure risk.
This tier system is not stylistic—it is a structured, engineering-based classification derived from kinetics, diffusion considerations, and archival baselines.
How to Use the Preservation Tier Table
The preservation tier table translates the failure modes (FMs) from the FMEA into engineering controls that prevent or slow those failures. Each column in the table corresponds to one or more FMs and specifies the environmental or design requirement needed to keep that FM inactive or low-likelihood. In other words, the table is not describing “nice-to-have” storage features—it is a specification of what must be controlled to keep FM1–FM7 from progressing into their associated failure effects (FF1–FF5).
Tiers are built by stacking these controls.
Tier 5 has almost no controls, so multiple FMs can progress freely.
Tier 4–3 apply partial control to some FMs, but not consistently or not to
engineering thresholds.
Tier 2 controls all major degradation pathways chemically and mechanically, but without full verification.
Tier 1–0 control all major degradation pathways and require verification
(scavenger performance, RH stability, diffusion access, and no local acid accumulation).
This table should be used as a design and assessment tool: designers can use it to ensure their enclosure or frame actively suppresses each relevant FM, and collectors can use it to evaluate how their setup handles chemistry (Q), diffusion (D), moisture, geometry, and cycling stresses. When a tier is chosen, the associated controls become the minimum engineering requirements needed to maintain that tier’s likelihood band.
Assumptions & Limitations of This Framework
This preservation tier framework is based on current scientific and engineering understanding of cellulose acetate hydrolysis, acetic acid diffusion, and environmental stressors. The following assumptions are used when defining tier boundaries:
- CTA hydrolysis follows Arrhenius behavior within the stable (non-autocatalytic) regime.
- Tier 3 reflects the archival baseline of 70 °F / 50% RH used in historical vinegar syndrome research.
- Temperature and RH cycling are evaluated using worst-case indoor drift of ±3 °F.
- Water-activity thresholds assume typical CTA and paint stability ranges; empirical testing will refine these limits.
- UV risk is qualitative due to the absence of a universal UV-dose threshold for paint or CTA failure.
The Paint Glass Transition (Tg) Floor
A critical mechanical constraint in this framework is the Glass Transition Temperature (Tg) of common animation paints (Acrylics, Vinyl-Copolymers like Cel-Vinyl, and Gum Arabic/Gouache).
- The Brittle Threshold: Most animation paints undergo a phase change near 52°F (11°C) at 50% RH. Above this temperature, the paint is flexible. Below it, the paint enters a "glassy" state, becoming a rigid ceramic-like layer prone to shattering if the acetate base flexes.
- RH as a Plasticizer: Moisture is essential for flexibility. If RH drops below 30%, the Tg effectively rises, causing paint to become brittle even at warmer temperatures.
- Tier Selection: Tier 1 (53°F+) is engineered to stay safely above this mechanical "cliff." Vault Storage (<52°F) is chemically superior for the plastic but physically hazardous for the paint, intended only for static items that will not be handled.
As new data emerges—particularly from diffusion testing, pH modeling, and controlled reset experiments—the boundaries of each tier may be refined. The structure of the tier system, however, remains governed by physical principles rather than subjective preference.
Clarification: Scavenger Sizing & System Responsibility
“Sized scavenger capacity” may be met through either (1) a formal cel-to-scavenger mass ratio calculation, or (2) manufacturer-provided absorption data under relevant temperature and RH conditions. Either method is acceptable as long as performance is documented and verifiable for the intended microenvironment.
System vs. Material: Scavenger verification is a requirement for the system, not the material. Products such as MicroChamber are engineered and effective when used correctly, but frames and display cases often employ these materials in undersized or untested configurations. The responsibility to demonstrate proper sizing, diffusion access, and overall system performance rests with the frame or product manufacturer, not the archival-material supplier. This framework therefore evaluates the preservation system as a whole.
Minimum safe RH: Operating RH limits will continue to be refined with material-specific testing. For now, Tier 0–1 exclude saturation conditions and exclude ultra-dry RH levels that may induce mechanical stress or excessive water-vapor gradients.
Preservation Management Lifecycle: Using Tiers Over Time
The preservation tiers describe how safe a storage environment is right now. In practice, cel care is not a single decision — it is a management cycle. Cels move from stable, lower-risk conditions into higher risk as chemistry drifts, and effective collectors use a repeating loop of assessment, preventive care, monitoring, intervention, and review to keep R (acid generation) low and D (acid accumulation) controlled.
Not every collector is aiming for a Tier 1 or Tier 2 environment. The “right” tier depends on collector goals: desired display vs. storage, acceptable risk, and the target lifetime for the cel. The Cel Nexus risk / lifetime tool helps quantify how each tier affects estimated years of stability, making it easier to choose a tier aligned with your preservation goals.
1. Assessment / Intake
By the time vinegar odor is obvious, chemical breakdown is already underway. Intake is where you establish a baseline so tier decisions are grounded in data instead of guesses:
- AD strips or vapor tests in a known volume to estimate vapor-phase acidity trend.
- Quick odor/ppm check to confirm whether D is already elevated.
- Photographs and a simple condition log (warp, blocking, paint status, annotations).
This baseline tells you whether a cel can reasonably stay in lower tiers for your goals or whether it is already in a Tier 3 / vinegar-positive state that needs more aggressive management or reset planning.
2. Preventive Care
Passive storage — an inert binder in a fluctuating room, or a basic frame with no RH control — is still slow chemical drift. Preventive care means moving the cel into an environment where Lchem is intentionally improved relative to your target life:
- Cold storage that meaningfully increases lifetime relative to a 70 °F, 50 % RH baseline.
- RH control that keeps the material within safe absolute humidity bounds.
- Boundary-layer and enclosure designs that control how acetic acid escapes or is captured.
- Inert sleeves and support materials that avoid adding new chemical risk.
In tier language, preventive care is how you place a cel in the tier that best matches your goals: a display-first collector may accept Tier 0–2 tradeoffs, while a long-term preservation collector may target Tier 1 or better. The life-expectancy / risk tool is what connects these choices to estimated years of stability.
3. Monitoring
Without measurement, every storage choice looks fine until it fails. Monitoring is how you confirm that a chosen tier is actually being delivered in practice:
- Periodic AD strip checks in representative containers or binders.
- Basic sensor logging (temperature, RH) at the storage location instead of relying on room averages.
- Occasional ppm tube tests for higher-risk or vinegar-positive cels, when available.
Monitoring links the abstract tier labels back to real data. If a setup that was modeled as Tier 1 is consistently running warmer or wetter than intended, or if vapor acidity is rising, the framework tells you to re-classify the cel and adjust your plan or goals.
4. Intervention / Reset
Waiting for visible warping or paint loss leaves little room to recover. Intervention is where you deliberately reduce D (stored acid) and, where possible, improve R by rehousing. Depending on your goals and the cel’s condition, that may include:
- Conditioning in a reset environment with controlled temperature and ~30% absolute humidity.
- Using molecular sieves or engineered scavengers sized and placed for effective diffusion and absorption.
- Rehousing into microenvironments or containers that better support the target tier and lifetime.
The goal is not simply to “feel better” about storage, but to move the cel back toward a tier that gives a measurable lifetime benefit relative to its current chemical state and your target horizon (e.g., 10, 20, or 30 years).
5. Review & Planning
The final stage closes the loop so preservation stays proactive instead of reactive:
- Schedule reassessments based on risk and goals — vinegar-positive or high-value cels are checked more often.
- Update lifetime expectations as new AD data, pH estimates, or environment logs come in.
- Decide whether to adjust goals (accept a lower tier) or invest in higher tiers and/or reset work.
Over time, this turns preservation from “set and forget” into a managed program. The tier framework becomes not just a label for storage hardware, but a way to track where each cel sits on the degradation curve, what level of risk you are accepting, and how your actions are shifting its trajectory toward your chosen outcome.
Collector Practice vs. Preservation Model
The table below summarizes how the same lifecycle looks under casual collector habits versus a structured, goal-aligned tier-based approach.
| Stage | Common Collector Practice | Preservation Model |
|---|---|---|
| Assessment / Intake | Wait for vinegar smell; no systematic intake or logging. | Baseline AD/ppm trend, photos, and condition log; assign an initial tier based on environment and goals. |
| Preventive Care | Inert binders/frames in uncontrolled rooms; “good enough” assumptions. | Deliberate choice of Tier 0–2+ based on temperature, RH, diffusion, and target lifetime from the risk tool. |
| Monitoring | No periodic checks; issues found only when visually obvious. | Regular AD strip checks, sensor logs, and spot ppm tests to confirm the tier is actually being delivered. |
| Intervention / Reset | Ad-hoc fixes after warping or paint issues appear. | Planned conditioning, scavenger use, and rehousing when data shows rising acidity or risk relative to goals. |
| Review & Planning | None; storage rarely revisited once “done.” | Scheduled reassessment, updated lifetime models, and targeted upgrades or goal adjustments as cels drift toward higher tiers. |
Closing Thoughts – Choosing Your Tier
At the end of the day, every collector is choosing a tier, whether consciously or not. Leaving cels in warm, humid, unbuffered environments pushes them toward the right-hand side of the bathtub curve sooner. Basic archival steps put you in the middle lane. Only deliberate temperature, humidity, and vapor-phase control — plus smart geometry — actually push your cels into the high tier where the clock slows down.
In future posts, we’ll walk through example setups and show how to move a specific cel from low → medium → high tier using real products, measured conditions, and test data.
For readers who want the full risk logic behind these tiers, Appendix A documents the scoring framework that underpins the calculator and CPES-01, including how we combine likelihood and consequence across different vectors.
Appendix A – Vinegar Syndrome Chemistry: Temperature, Humidity & The "Vinegar Smell"
Appendix A: Vinegar Syndrome
This appendix defines the quantitative method used to compute the Lchem,env likelihood bands. These bands represent how aggressively an environment drives hydrolysis in a stable cellulose triacetate (CTA) cel over a multi-decade horizon.
Lchem,env is an environment aggressiveness indicator driven primarily by
temperature and water availability (absolute humidity), then adjusted for
microenvironment behavior (sealed/stagnant geometry, vapor paths, scavengers).
It is not a direct measurement of current cel condition, and it does not directly represent
the FM2 runaway / autocatalytic regime shift. FM2 is treated separately because it is
threshold- and state-dependent (it depends on the cel’s starting acidity / acid loading
in addition to the environment).
In the framework: FM1 + FM3 describe the drivers (generation + transport/removal behavior). FM2 describes the regime shift (runaway). We score FM2 separately as LVS,run using observable indicators (AD band / ppm band, odor, warping onset, diffusion traps), because collectors can actually measure those without lab instrumentation.
A1. Overview
Lchem is derived in three steps:
- Compute a relative hydrolysis forcing rate krel using Arrhenius temperature scaling and absolute humidity.
- Map krel to a base likelihood band representing probability of VS initiation (1–5).
- Apply microenvironment modifiers (geometry, scavenging, paint coverage) that affect acid accumulation.
This methodology intentionally avoids visual or structural condition inputs. Those belong to the Consequence (C) axis and structural likelihood vectors.
A2. Step 1 — Relative Hydrolysis Forcing krel
(a) Temperature term — Arrhenius response
CTA hydrolysis follows Arrhenius behavior with an activation energy of approximately 105 kJ/mol:
k_rel,T = exp[-Ea/R · (1/T_K − 1/T₀,K)]
- Ea = 105,000 J/mol
- R = 8.314 J/mol·K
- T₀ = 70 °F reference (converted to Kelvin)
(b) Moisture term — absolute humidity
Hydrolysis is governed by water availability, not RH directly. RH is therefore converted to absolute humidity (AH):
AH = 2.1674 × ( e_s(T) × RH_frac ) / T_K

e_s(T) = 6.1094 × exp(17.625 T_C / (T_C + 243.04))
Normalized moisture forcing:
AH_rel = AH / AH₀
k_rel,AH = AH_rel^0.6
(c) Combined forcing
k_rel = k_rel,T × k_rel,AH
Interpretation: krel represents how strongly the environment drives acid generation relative to the institutional baseline. It does not indicate that damage is occurring — only that the system is being pushed toward or away from the autocatalytic threshold.
A3. Step 2 — Mapping krel to VS Initiation Likelihood
The following bands map krel to the probability that a stable cel will enter autocatalytic vinegar syndrome (FM2) within a multi-decade time horizon:
A4. Step 3 — Microenvironment Correction Factors (environment-side modifiers)
FM3 effects are incorporated through multiplicative modifiers that represent how efficiently generated acid is removed or trapped:
M_total = M_geometry × M_scav × M_paint
These modifiers do not change the chemistry. They change whether acid accumulation crosses the autocatalytic threshold.
A5. Interpretation & Scope Limits
Lchem is a trigger likelihood. It answers one question:
It does not attempt to quantify:
- Current film acidity
- Visible warping or odor
- Paint cracking or delamination
- Molecular bond scission metrics (e.g., FTIR)
Those effects are downstream of FM2 and are evaluated using structural likelihood vectors and the consequence axis. This separation keeps the framework physically correct and readable.
Appendix B – Light Damage: Fading, Yellowing & UV Exposure Risks
LUV (Likelihood) — Light-Driven Photochemical Damage
LUV quantifies the likelihood of light-driven photochemical degradation to both paint and cellulose acetate. Unlike other failure modes, UV damage is governed by dose × time, not temperature, humidity, or mechanical loading.
UV exposure causes:
- Paint fading and pigment breakdown
- Yellowing and embrittlement of CTA
- Loss of visual contrast and surface integrity
Why UV is Scored Qualitatively
In theory, UV risk could be calculated from wavelength, intensity, exposure time, and material sensitivity. In practice, collectors rarely know:
- Actual UV content of room lighting
- Lux levels at the cel surface
- Total cumulative exposure over years or decades
For this reason, LUV is intentionally behavior-based, anchored to how and where the cel is displayed rather than attempting false precision.
What LUV Does — and Does Not — Capture
- Captured: cumulative risk from routine display behavior
- Captured: presence or absence of UV filtering
- Captured: proximity to windows and daylight paths
- Not captured: RH effects (handled in FM5)
- Not captured: chemical degradation (FM1 / FM2)
- Not captured: mechanical stress or compression (FM5 / FM8)
A cel may score low on UV risk while still being at high mechanical or chemical risk. UV is a separate vector and must be evaluated independently.
Scoring Guidance
Assign LUV based on the most representative long-term display condition, not occasional short-term handling.
- LUV = 1–2: Storage-dominant, rare viewing, UV-filtered light
- LUV = 3: Routine indoor display without direct sun
- LUV = 4–5: Near windows, frequent bright display, or sun exposure
For a deeper discussion of photochemical mechanisms, UV filtering limits,
and display tradeoffs, see:
→ Blog: UV Exposure, Display Risk, and Why “UV Glass” Is Not a Cure-All
Appendix C – Warping & Curling: The Physics of Humidity Cycling (Bending Risk)
Lstruct,geom (Likelihood) — Support Geometry + Handling + RH Cycling
Lstruct,geom quantifies the likelihood of time-dependent geometric damage (bowing, curl, edge stress, corner creep, handling-induced bending) driven by two coupled inputs: (1) support geometry / constraint and (2) repeated water-activity (RH) cycling. This is a fatigue-style failure mode: damage accumulates from many cycles, even if no single cycle looks extreme.
This score does not include paint flattening or pressure imprinting (that is handled separately in Lstruct,comp).
What “RH cycling” actually means (and why “average RH” is not enough)
Collectors often think of RH as a single value (“I store at 50%”). In reality, the cel experiences a band of RH over time — and the cycling amplitude (ΔRH) is what drives mechanical fatigue. The cel is a composite: CTA base + paint islands. When RH changes, CTA absorbs/desorbs moisture and wants to swell/shrink. Paint responds differently (different uptake, stiffness, and expansion). That mismatch creates interfacial shear and bending moments.
Paint and cellulose acetate do not expand/contract the same way. They have different coefficients of thermal expansion (CTE) and hygroscopic expansion (CHE). During temperature or humidity cycling, the substrate and paint attempt to move by different amounts, generating interfacial shear stress that can lead to paint lift, cracking, and flaking.
A simplified strain-mismatch expression is:
Δε ≈ ΔT·(αfilm − αpaint) + Δaw·(βfilm − βpaint)
This is why cycling environments (even “cold cycling”) can be mechanically harsher than a stable room:
cycling increases ΔT and Δaw, increasing interfacial stress.
In tier terms: stability can reduce Lstruct even when average temperature is not minimal.
Why RH shifts during temperature drift (even if you didn’t “add moisture”)
A temperature drift can create RH cycling even when the amount of water in the air (absolute humidity) is constant, because saturation vapor pressure changes strongly with temperature:
RH = e / esat(T)where
e is actual water vapor partial pressure and esat(T) rises with temperature.
Practical translation: the cel can see RH cycling from (a) HVAC drift, (b) fridge compressor cycling / door openings, and (c) absolute humidity “events” (cooking/shower) — even if your thermostat or setpoint looks “stable.”
Why this matters mechanically (failure mechanisms)
- Interfacial fatigue: repeated mismatch strain drives micro-slip, microcracking, and eventual edge lift/delamination.
- Bending / curl: transient moisture gradients through thickness create bending moments (especially with non-uniform paint).
- Creep-set: moisture and acidity can soften layers, making deformation more time-dependent and permanent.
- Geometry multiplier: tight mats/frames, constrained sleeves, or poor support converts “free strain” into stress.
Likelihood scale (ΔRH bands + examples)
| Lstruct | Relative Structural / Mechanical Risk (50 yrs) | Examples (handling + RH cycling) |
|---|---|---|
| 1 – Very Low | RH cycling ΔRH < 5% per typical cycle (much tighter than a good room). | Microclimate buffered so the effective aw band is extremely narrow (engineered small volume, buffered cold box, stable enclosure). |
| 2 – Low | RH cycling 5% ≤ ΔRH ≤ ~10%, slightly better than or equal to a best-case room. | Room or microclimate held near a stable setpoint with modest drift; generally as good as a well-behaved 70 °F / 50% room. |
| 3 – Neutral | RH cycling ≈10–12% per typical cycle (reference case). | Typical interior drift around 70 °F with constant AH (baseline “survivable” historical storage). |
| 4 – High | RH cycling ~12–20%, but still without sustained condensation. | Large day–night swings, seasonal spikes, repeated excursions above ~60% or below ~30% RH, yet not routinely hitting saturation. |
| 5 – Very High | RH cycling > 20%, including condensation or very low RH episodes. | Environments that push aw toward 1.0 (condensation, damp basements) or very low for long periods, combined with repeated T/RH shocks (unbuffered fridge cycling, attic/garage extremes). |
Scoring note: Use Lstruct,geom when the failure mode is bowing/warping/curling, corner stress, edge creep, or “frame as a clamp.” Use Lstruct,comp when the failure mode is paint flattening, texture transfer, blocking patterns, or imprinting from localized contact pressure.
Appendix D – Stacking Damage: Paint Sticking, Compression & "Creep"
What Lstruct,comp Represents
Lstruct,comp quantifies the likelihood of time-dependent mechanical damage to paint and surface features caused by sustained localized contact pressure. This includes raised-paint flattening, texture transfer, blocking patterns, and pressure-driven creep — failure modes that are not captured by temperature, humidity, or chemical aging models.
Unlike bending or RH-cycling damage (handled under Lstruct,geom), compression damage is driven by the physics of pressure × time, where relatively modest forces become damaging when concentrated over very small contact areas (paint ridges, islands, stuck regions) and held for months or years.
P = F / A), not by the total number of pages, binder thickness,
or overall stack height.
Why This Matters
Compression damage is often hidden and time-dependent. A cel may appear stable for years before subtle texture loss or blocking becomes visible — at which point the deformation is permanent. Because this failure mode is strongly amplified by chemical softening (e.g., vinegar syndrome), it frequently acts as a multiplier on other risks rather than an isolated issue.
Methodology Summary
Lstruct,comp is evaluated using a conservative, physics-based approach:
- Estimate load (F): mass of pages and binder components acting on a given cel position.
- Assume a worst-case contact area (A): small paint ridges or islands (typically a few cm²), not full-surface contact.
-
Compute local pressure:
P = F / A. - Account for dwell time: pressures that are harmless for minutes of handling can cause damage under multi-year storage.
- Map pressure bands to likelihood: Green / Yellow / Red zones correspond to increasing probability of long-term deformation.
The table below expresses these pressure bands directly as Lstruct,comp levels (1–5), enabling consistent scoring across storage formats (binders, stacks, portfolios, boxes).
Lstruct,comp (Likelihood) — Compression / Contact-Pressure Damage on Paint
| Lstruct,comp | Pressure / Dwell Interpretation |
|---|---|
| 1 — Very Low | Green zone: P ≤ 2 psi at contact features, or effectively near-zero contact (large flat area, strong spacers, or no stacking). Multi-year dwell is unlikely to imprint or deform paint. |
| 2 — Low | Low Yellow: 2 < P ≤ 3 psi. Generally safe, but cumulative risk exists for thick or soft paint, or chemically weakened (VS-active) cels under long dwell. |
| 3 — Neutral | Upper Yellow: 3 < P ≤ 5 psi. Time-dependent risk band. Multi-month to multi-year dwell can contribute to subtle flattening, blocking patterns, or texture transfer. |
| 4 — High | Red onset: 5 < P ≤ 7 psi. Not instant failure, but undesirable as a long-term resting load, especially for raised linework, heavy paint islands, or any cel with active VS or surface stickiness. |
| 5 — Very High | Deep Red: P > 7 psi and/or repeated long dwell under load. High likelihood of permanent deformation or imprinting within years (or sooner if paint is softened). |
Pressure bands are defined using left-open, right-closed intervals to eliminate overlap; borderline cases are conservatively assigned to the higher risk band.
Detailed Derivation & Examples
Full derivations, real binder measurements, and worked examples — including vertical vs. horizontal storage tradeoffs — are documented separately:
The framework appendix defines what is being scored and how; the linked articles document why the bands were chosen and how they were derived in practice.
Appendix E – Safe Materials: Acid-Free Boards, Plastics & Off-Gassing Risks
Enclosure Contamination & Compatibility
FM7 captures risk from external materials adding chemical stress to the cel. While mechanical risks (like sticking) are often driven by storage pressure, FM7 is an inherent material risk.
| Likelihood | Enclosure Condition | Interpretation |
|---|---|---|
| Unlikely | All enclosure materials are known-compatible or tested archival (e.g., PET/Mylar, inert plastics, buffered boards, metals, glass). | The enclosure does not contribute meaningful chemical loading. FM7 can be neglected as a primary risk driver. |
| Likely | One or more enclosure components are chemically active, untested, or known-incompatible (e.g., PVC, rubber foams, unknown plastics, pressure-sensitive adhesives, acidic boards). | The enclosure is a probable source of volatile acidity or solvent load. FM7 should be treated as an active chemical risk contributor. |
FM7 is scored categorically rather than on a continuous scale. If incompatible or unverified enclosure materials are present, treat FM7 as Likely. If all materials are known-compatible or tested archival, treat FM7 as Unlikely.
FM7 does not receive its own numeric L-score. Instead, it acts as a modifier to chemical and mechanical likelihoods (e.g., elevating Lchem or accelerating FM8 when present).
| Class | Examples | FM7 Logic | Practical Note |
|---|---|---|---|
| Known-Compatible | Uncoated PET (Mylar), Polypropylene (PP), Buffered Rag Board. | Chemically Inert. No off-gassing. | Gold Standard. Best for chemical isolation. Manage sticking risk via low-pressure stacking. |
| Conditional | "Acid-free" wood pulp, Glassine, unknown archival foams. | Potential for Acid Reversion. | Glassine is "non-stick" but can become acidic and hygroscopic over time. Use with caution. |
| Incompatible | PVC (Vinyl), Rubber, Cardboard, Pressure-sensitive tapes. | Active Hazard. HCl & Plasticizers. | Causes "Vinyl burn" and melts paint regardless of pressure. Remove immediately. |
The "Pressure vs. Chemistry" Rule
Sticking (adhesion) is primarily a function of pressure, heat, and humidity. Using a "safe" material like Mylar does not cause sticking in a well-managed environment. Conversely, a "non-stick" material that is chemically active (like PVC or cheap paper) will destroy a cel even if it never touches the paint.
Fast Triage Rules
- The Sniff Test: "New car" or "Pool toy" smell = PVC (Immediate Removal).
- Isolation: If using "Conditional" materials, use a Mylar barrier between the cel and the material.
- Stack Height: Keep cel stacks thin to prevent the mechanical adhesion that critics of Mylar fear.
Appendix F – Handling Risks: Cracking Paint, Creases & Physical Damage
Lstruct,event (Likelihood) — Event-Based Mechanical Damage
Lstruct,event quantifies the likelihood of discrete, handling-driven mechanical damage to animation cels. This failure mode is caused by events rather than slow accumulation: drops, flexing, pinching, over-tightening, mishandling during reframing, or improper storage transitions.
Unlike RH cycling / dimensional fatigue (handled under Lstruct,geom) or time-dependent compression (handled under Lstruct,comp), FM8 captures impulsive or episodic stresses that can cause immediate damage or seed latent defects that later propagate.
Why Event-Based Damage Matters
Event damage is often binary: nothing happens… until something does. A single mishandling event can introduce:
- Permanent creases or kinks
- Local delamination or paint cracking
- Edge stress that later evolves into curl or lift
- Stress risers that amplify RH cycling or compression damage
Because FM8 damage is often invisible at first, it frequently acts as a risk multiplier for other failure modes rather than a standalone issue.
Methodology Summary (Qualitative)
Lstruct,event is evaluated qualitatively based on handling frequency, support adequacy, and event severity over long time horizons.
- Frequency: How often the cel is handled, reframed, transported, or accessed
- Support: Whether handling is rigidly supported or allows flexing
- Constraint: Whether frames, binders, or sleeves act as clamps or pinch points
- Margin: Whether clearance and slack exist to absorb mistakes
Relationship to Other Structural Likelihoods
- FM5 (RH cycling): governs fatigue and slow curvature over time
- FM7 (compression): governs pressure × time damage at contact patches
- FM8 (events): governs discrete failures and damage initiation
In scoring, FM8 should be elevated whenever handling, reframing, or support transitions are frequent — even if RH and compression risks are otherwise well controlled.
Reference
For a deeper discussion of structural failure modes, support geometry, and how event damage couples with fatigue and compression, see:
Related article:
“Handling, Support Geometry, and Mechanical Failure in Animation Cels”
(Framework reference blog)
Appendix G – Storage Solutions Compared: Binders vs. Boxes vs. Cold Storage
Application of preservation tiers to common storage
The appendices provide applied examples of how the risk framework and preservation tier system behave in real storage environments. Each appendix takes a common setup—binders, frames, cold boxes, open shelves, reset containers—and evaluates it using the same logic defined in the risk framework. These examples are not part of the core framework; they simply demonstrate how to use it. Readers who only want practical outcomes can skip directly to the appendices without losing continuity.
To make the R (acid generation) vs D (acid emission) framework concrete, we’ll compare the same cel in the same sleeve stored four different ways in the same house. Only the microenvironment changes.
Tier-3 and above require measured improvement. If the microclimate isn’t better than the room, it isn’t a tier.
Scenario 1 — Open Room Air (Tier 4 – Unbuffered Baseline)
The cel sits in its sleeve on a shelf or in a cabinet, fully exposed to whatever the house is doing. A thermostat might read “70 °F / 50 % RH,” but residential conditions are not equivalent to controlled archival storage. In practice, a typical home:
- swings ±2–6 °F per day from HVAC cycling, sunlight, cooking, and occupancy,
- sees RH changes from showers, cooking, and door/window drafts,
- drifts with seasonal dewpoint and outdoor weather.
In other words, “70/50” in a house really means “around 70/50, with frequent excursions.”
R (generation): high. Hydrolysis rate increases with both temperature and
water activity (aw). Because both are uncontrolled and fluctuate significantly in a
typical room, the cumulative hydrolysis rate R over time remains high.
D (emission): high, but diluted. Any acetic acid that reaches the cel surface diffuses into the
large room volume and is quickly diluted. Local ppm at the sleeve edge may spike briefly, then wash out.
Net effect: The cel experiences a relatively high R due to warm, unstable conditions, while D
simply hides the off-gas in a huge volume. A lack of vinegar smell is a sign of diffusion and dilution,
not safety.
Scenario 2 — Closed Box in the Same Room (Tier 4 Unless Measured)
Now place the same cel and sleeve inside a closed, non-vented box stored in the same room. Collectors often assume that any enclosure is automatically safer, but a box only earns a higher tier if it demonstrably improves the microclimate compared to the room.
R (generation): only reduced if buffering is meaningful. A box can smooth out some temperature and
humidity swings, but the improvement has to be large enough to matter. Using cellulose acetate’s activation energy
(~105 kJ/mol), the Arrhenius relationship shows that:
- ~1 °F reduction in temperature → ≈ 11 % reduction in R,
- ~2 °F reduction → ≈ 20–22 % reduction in R,
- ~3 °F reduction → ≈ 33 % reduction in R.
In logged tests, the box averaged ~70 °F and ~49 % RH — effectively the same as the room. In that case, the
hydrolysis rate R was not meaningfully reduced, and no tier improvement is earned.
D (emission): initially high, then limited by feedback. In a small enclosure (1–3 L),
vapor-phase acid accumulates quickly because the air volume cannot dilute it. As concentration rises, the gradient
between the film and the air decreases. Off-gassing does not stop — it becomes slower because the driving force
has weakened.
Net effect: The usefulness of a closed box depends entirely on whether the reduction in acid
generation (R) is significant enough to outweigh the penalty of slowed emission (D). If buffering
measurably lowers temperature or stabilises RH, the reduction in R can be large enough that trapped acid becomes a
tolerable compromise, making the box safer than open air. If buffering is weak and R remains similar to the room,
then trapping acid offers no benefit.
Frames without engineered microclimates can behave similarly to this scenario, but add heat sources (lights, wall surfaces) and contact-layer complexity. They are evaluated separately in the frame appendix.
Scenario 3 — Closed Box Placed in a Household Fridge (Tier 5 – Cold but Wet + Cyclic Fatigue)
This is the intuitive mistake: “Cold slows vinegar syndrome, so I’ll put my cel box in the fridge.” The box is sealed at ~70 °F / 50 % RH, then cooled to ~40–45 °F.
R (generation): cold helps, high aw hurts.
Cooling from ~70 → ~40 °F can reduce hydrolysis roughly 10×, but the sealed air keeps the same water content. At 40 °F the saturation vapor pressure is much lower, so the air is pushed toward saturation and liquid water can form on cold surfaces. Chemically, this means aw is driven toward 1.0. The net hydrolysis rate is still lower than a warm room, but not as low as an engineered cold microclimate that deliberately buffers aw in a mid-range band.
D (emission): chemically awkward.
Acid can partition into condensed droplets or very humid boundary layers that sit directly on or near the paint. That creates paint-layer acid loading, not just base-film acidity, and the small cavity provides little dilution.
T/RH cycling = mechanical fatigue (Lstruct, not Lchem).
Household fridges are not static: compressor pulses, defrost cycles, fan bursts, and door openings all cause repeated T/RH swings. Paint layers expand and contract differently than CTA, and they absorb/desorb moisture at different rates, creating shear fatigue, delamination risk, and potential cracking over long timelines.
Net effect: A sealed box in a fridge is not Tier 2, and usually behaves more like Tier 5, because it combines:
- chemistry that is only moderately better than a good room,
- very high aw at the film/paint interface, and
- strong mechanical cycling that drives Lstruct to the top of the scale.
Scenario 4 — Engineered Cold Microclimate (Tier 1 – Sealed, Buffered, Static)
Finally, take the “box” concept and engineer the microclimate so that cold storage works in your favor instead of against you:
| Controlled feature | Requirement |
|---|---|
| Temperature | Stable 40–50 °F with minimal cycling. |
| Water activity | Buffered aw in a safe intermediate range — not 0, not 1.0. |
| Off-gas | One-way removal via conditioned scavenger (zeolite / MicroChamber / sieve / blend). |
| Internal volume | Small on purpose: maintains a strong gradient from film to scavenger. |
R (generation): very low.
- 70 → 50 °F ≈ 5× reduction in hydrolysis rate,
- 70 → 40 °F ≈ 10–12× reduction,
- water activity is controlled rather than forced toward saturation.
D (emission): high and one-way.
A properly sized and pre-conditioned scavenger keeps internal acidity near 0 ppm, maintaining the concentration gradient indefinitely. Acid leaves the film and is captured rather than recirculating.
Mechanics: static (no cycling).
No repeated thermal or moisture shocks means minimal mechanical fatigue and a greatly reduced risk of paint delamination or cracking from micro-movements.
Net effect: Engineered cold microclimates uniquely achieve:
- the lowest practical R (generation),
- monotonic, one-way D (emission) into a sink,
- stable, buffered aw,
- minimal mechanical stress.
This is the only storage condition in this case study that truly keeps the cel in the flat, stable middle of its
lifetime curve.
| Vector / Factor | Scenario 1 Open room |
Scenario 2 Closed box in room |
Scenario 3 Box in fridge |
Scenario 4 Engineered cold microclimate |
|---|---|---|---|---|
| Environment vectors (Tier table) | ||||
| T – Temperature |
Tier 3 T. Interior ~65–75 °F with typical HVAC drift. |
Tier 3 T. Box tracks same ~65–75 °F room band. |
Tier 1 T. Cold ~40–45 °F, but tied to fridge cycling. |
Tier 1 T. Stable 40–50 °F with tight control. |
| aw – Moisture / RH |
Tier 4. Swinging RH from daily life (showers, seasons); no buffering. |
Tier 4. Same average RH as room; box can trap spikes, no logging. |
Tier 5. aw → 1.0 with condensation in a sealed cold box. |
Tier 1. Buffered mid-range aw (≈35–55 %) at cold; avoids saturation. |
| M – Mechanical / cycling |
Tier 3. Normal HVAC cycling; no extreme shocks. |
Tier 3. Same room cycling; box itself does not add cycles. |
Tier 5. Compressor, defrost and door openings drive repeated T/RH shocks. |
Tier 1. Static mechanics; minimal handling, no compressor cycling. |
| D – Emission / diffusion |
Tier 3. Free emission into a large, well-mixed room volume. |
Tier 4. Small sealed box; vapor accumulates and boundary layer stagnates. |
Tier 5. Tight saturated cavity; trapped and re-equilibrating vapor. |
Tier 1. Clear one-way path from cel to sink; no stagnant dead zones. |
| S – Scavenger & chemistry |
Tier 3. No engineered sink, but also no strong acid source parked next to the cel. |
Tier 3–4. No sink; if other acidic materials share the box, risk trends toward Tier 4. |
Tier 5. No sink; condensed droplets can behave like acidic micro-reservoirs. |
Tier 1. Sized, pre-conditioned sink matched to volume and time. |
| V – Volume & geometry |
Tier 3. Room-scale volume; sleeves/binders breathe with the room. |
Tier 4. Small 1–3 L box; no deliberate diffusion design. |
Tier 5. Tight micro-box; little air space, strong boundary trapping. |
Tier 1. Small, deliberate cavity with both faces of the cel exposed to the microclimate. |
| U – Light / UV |
Tier 3 (assumed). Indoor light, not direct sun or window display. |
Tier 1–2. Closed box is effectively dark; minimal UV exposure. |
Tier 1. Fridge environment is dark. |
Tier 1. Stored dark by design; any viewing uses UV-filtered glazing. |
| Overall environment tier (min of vectors) |
Tier 4 | Tier 4 | Tier 5 | Tier 1 |
| Vector likelihoods and combined score | ||||
| Lchem (Arrhenius + aw + feedback) |
4 – High | 5 – Very High | 3 – Moderate | 1 – Very Low |
| Lstruct (RH cycling + mechanics) |
3 – Neutral | 3 – Neutral | 5 – Very High | 1 – Very Low |
| Luv (dose, spectrum, duration) |
2 – Low | 1 – Very Low | 1 – Very Low | 1 – Very Low |
|
Lcombined 0.5·Lchem + 0.25·Lstruct + 0.25·Luv |
≈ 3.3 | ≈ 3.5 | ≈ 2.8 | ≈ 1.0 |
The combined likelihood is not a replacement for the individual vectors – it simply compresses the chemical, structural, and UV tracks into a single summary number for comparing environments at a glance. Tier assignment still uses the environment vectors plus the VS-specific Lchem method developed in Appendix A.
Appendix H – Framing Animation Art: Why Standard Frames Fail
Application of the Risk Framework to Cel Framing
This appendix applies the full multi-vector risk framework—chemical, structural, and UV—to framed display environments. Framing introduces unique mechanical, thermal, and vapor-geometry constraints that differ from binders or box-based microclimates, and therefore must be evaluated separately.
As with Appendix B, this section is not part of the core framework itself.
Instead, it shows how to score real framing setups using the
environment vectors, the VS likelihood (Lchem) method from Appendix A,
and the structural / UV likelihood tables.
Framing is never neutral. Frames alter temperature, moisture cycling, diffusion geometry, and UV dose—often in opposite directions. The goal of this appendix is to map those changes onto the tier system so collectors and framers can design safe display environments.
Case Study: Display Frames With MicroChamber Boards
Do scavenging boards make frames preservation-safe?
For this appendix, we compare two scenarios that bracket the full performance range of framed display systems:
- a standard sealed frame with no scavenger (the common real-world baseline), and
- a theoretical best-case frame using a fresh MicroChamber board with perfect, unobstructed diffusion and an oversized absorption capacity.
These two cases matter because they show the functional ceiling of framed display systems. A frame can occasionally outperform its room in narrow, short-term ways—such as mild thermal buffering or a temporary RH dip if a dry MicroChamber board absorbs moisture. But these benefits are transient and highly geometry-dependent. The same enclosure that buffers heat or moisture can also trap both, along with acetic acid.
Crucially, framing never changes the hydrolysis reaction itself. The rate at which ester bonds cleave—and fresh acetic acid is generated inside the film—is set by temperature, absolute humidity, and local pH. A frame does not actively control T or AH, and it cannot raise the internal pH of an already-acidic cel. At best, it is a boundary condition on the feedback loop: how easily vapor leaves the boundary layer and how much of that vapor is captured vs recycled back into the film.
That feedback behavior is load-dependent:
- At low emission levels (early or stable cels), even a somewhat inefficient diffusion path may still move enough vapor to a scavenger to keep local ppm modest.
- At higher emission levels (VS-positive cels), the same geometry can become a recycling trap: acid generation outpaces removal, local pH drops, and autocatalytic feedback accelerates despite the presence of MicroChamber.
Key insight: Frames do not slow acid generation; they only influence acid feedback. If diffusion geometry or scavenger access is even slightly wrong, the frame fails to provide slowdown and may amplify feedback. Any claim of “preservation framing” therefore has to be evaluated against the cel’s emission rate, diffusion paths, and scavenger kinetics—not just the presence of a branded board.
Worse, every time a frame is opened, the internal cavity is flooded with the room’s current temperature and humidity. Whatever equilibrium the MicroChamber had previously reached is reset. If a frame requires “breathing” to feel safe, it is not performing as a microclimate system at all.
In other words, even an idealized frame—fresh board, perfect diffusion, low-emitting cel—tops out at a conservative Tier 3 because it does nothing to reduce the underlying hydrolysis driver (T/AH). The sections below explain why realistic installations, with mats, pockets, unknown capacity, and unmeasured ppm, almost always fall well short of that ideal case.
| Storage setup | Assumptions | Lbase (AH/T only) | Microenvironment factors | Final Leff | Interpretation |
|---|---|---|---|---|---|
| Standard sealed frame, no scavenger | 70 °F / 50% RH room; sealed cavity; multiple layers and dead zones. | 3 (Neutral) | Geometry trapping; no diffusion escape; small volume amplifies ppm. | 4 (High) | VS wear-out within 30–50 years is likely unless mitigated. |
| Frame with MicroChamber (ideal diffusion) | Board facing the cel; free diffusion path; scavenger oversized. | 3 (Neutral) | Sealed penalty cancelled; scavenger prevents buildup but does not change AH/T. | 3 (Neutral) | Comparable to a stable 70/50 room; not a protective tier. |
The table above shows the full spread: from a harmful sealed cavity (Leff = 4) to an idealized installation that merely restores room-equivalent conditions (Leff = 3). Importantly, neither scenario produces a protective microclimate. Frames cannot reduce AH/T, cannot stabilize moisture, and cannot buffer thermal gain.
Critique Highlights: Why Framed Displays Carry Elevated Risk
Before diving into the detailed failure mechanisms, three high-impact framing issues deserve special emphasis. These sharpen the distinction between physical protection and chemical preservation, and clarify why framed cels rarely rise above Tier 3 even when scavengers are present.
A. The “Spacer vs. Scavenger” Trade-off
Standard archival framing recommends spacers between the art and the backing to prevent paint sticking, mechanical abrasion, or moisture contact. However, this creates a stagnant boundary layer that isolates the cel’s vapor from the MicroChamber board.
- The conflict: Good structural practice (Lstruct) requires spacing to protect the paint, but good chemical practice (Lchem) requires direct access to the scavenger.
- The consequence: Archival spacing protects the paint physically but isolates the acetate chemically, cutting scavenger access by orders of magnitude.
Bottom line: Spacers solve one problem while worsening another. Most frames are built to protect the artwork’s surface, not to manage the vapor chemistry that drives acetate decay.
B. The “Capacity Blindness” Problem
MicroChamber boards have finite capacity. But unlike RH desiccants (which often change color when exhausted), a fully saturated MicroChamber board looks the same as a fresh one. There is no visual or quantitative indicator of remaining absorption capacity.
- The problem: A frame considered “safe” in 2015 may have been a sealed trap since 2020, with no visible sign of saturation.
- The addition: Unlike an AD strip that reports current vapor acidity, a spent scavenger board gives no warning unless the frame is opened and tested, which defeats the purpose of a sealed environment.
Bottom line: Without capacity monitoring or replacement intervals, scavenger-backed frames have an invisible “End of Life” that collectors cannot detect.
C. The “Ideal Case” Ceiling
The table above lists the ideal MicroChamber frame—fresh board, perfect diffusion, oversized capacity—as Tier 3 (Neutral). This claim is both correct and controversial, so it deserves explicit reinforcement.
- The defense: Even if the board absorbs 100% of the emitted acid, it cannot lower the temperature or regulate the absolute humidity of the room. These are the primary drivers of hydrolysis.
- The refinement: Because the frame does not modify T or AH, the underlying chemical degradation rate (krel) is identical to an open room. All the frame can do is mitigate feedback, and only if diffusion paths are ideal.
Bottom line: An ideal frame may prevent the environment from becoming worse than the room, but it cannot become better than the room without active climate control. Therefore, Tier 3 is the ceiling for passive, scavenger-based framing systems.
With the ceiling established, the next sections explain why real-world framed cels
almost always fall short of the ideal case. These limitations arise from:
- restricted diffusion pathways,
- layer-driven bottlenecks,
- unknown moisture and heat behavior,
- finite and unverified scavenger capacity,
- and a complete absence of ppm-level transparency from manufacturers.
The following subsections break down each limitation and show why a realistic framed display,
even with MicroChamber, conservatively scores Leff = 4 (High).
1. Scavenger presence ≠ scavenger access
MicroChamber is a surface-active scavenger. It only works where the cel’s vapor reaches it. Layer stacks with spacers, mats, backgrounds, and inner pockets create diffusion bottlenecks where acid may accumulate.
Without ppm-mapping within the frame, the system is conservatively Leff = 4 (High).
2. MicroChamber does not control RH
It does not behave like ArtSorb. Without a RH buffer, a frame can:
- trap seasonal humidity,
- over-dry, stressing paint layers,
- cycle unpredictably.
3. Internal heat behavior is unknown
Heat from walls, sun, or glazing can raise internal temperature 2–5 °F. Even a 2 °F rise increases hydrolysis rate significantly. Without temperature logging, no credit is given.
4. No published ppm-level data
Manufacturers publish qualitative claims, not:
- ppm near cel surface,
- ppm at boundary layers,
- ppm vs time absorption curves,
- capacity exhaustion data.
5. Finite capacity + unknown saturation state
MicroChamber saturates. But:
- no mg/cm² capacity is published,
- no replacement interval is specified,
- no storage conditioning step exists,
- humidity competes for adsorption sites.
6. Pre-install saturation (shipping, storage, retail)
Boards begin absorbing immediately at the mill. Humidity and pollutants absorbed during transit take up capacity intended for acetic acid.
Summary: Why realistic frames score Leff = 4
MicroChamber cannot be credited unless:
- internal RH is logged,
- ppm mapping is performed,
- diffusion pathways are validated,
- thermal gradients are measured, and
- remaining scavenger capacity is known.
Until then, the conservative score remains Leff = 4 (High).
| Missing verification | Potential failure mode |
|---|---|
| Internal RH monitoring | Moisture swings accelerate hydrolysis |
| ppm mapping (near & far) | Local buildup undetected |
| Layer diffusion analysis | Scavenger blocked by spacers/mats |
| Thermal characterization | Local hotspots increase R |
| Capacity / saturation data | Scavenger may already be spent |
| Pre-install saturation info | Board arrives partially loaded |
| Absorption-rate verification (kinetics) | Transient spikes during slow diffusion or slow scavenger kinetics may accelerate hydrolysis even if long-term average ppm appears low. AD strips measure averaged exposure and may not register short-duration peaks or conditions in adjacent air pockets. |
Bottom line: Framing with MicroChamber is not a preservation tier. It is a mitigation that prevents harm only when diffusion, capacity, moisture, and heat are all verified—not assumed.