A‑D Strips
AD strips are not just diagnostic—they are a decision-making tool. Understanding their limitations ensures you don’t get false reassurance or miss early warning signs. The strip color translates directly into whether to take preservation action (cooling, re-sleeving, scavenger use).
1) What A‑D Strips Are & How They Work
A‑D strips (Acid-Detection strips) are field indicators for acetic acid off‑gassing from acetate based films. They provide a low‑cost, non‑destructive diagnostic for detecting and trending vinegar syndrome and function as engineering‑useful threshold detectors—linking chemical kinetics to practical preservation action.
A‑D strips are indicator papers impregnated with a pH‑sensitive dye. When acetic acid vapor diffuses into the strip, hydrogen ions protonate the dye molecules, shifting the visible color (protonate = the dye picks up an H+ ion, changing its electronic structure and therefore its color). The indicator exists in two states: a deprotonated (basic, blue) form and a protonated (acidic, yellow) form. The strips are prepared with a neutral‑to‑slightly alkaline buffer so that, in clean air, the dye starts in its deprotonated blue state. Acetic acid vapor does not deliver “free H+” directly; it dissolves into a thin moisture layer on the strip and partially dissociates (HA ↔ H+ + A−), providing the protons that drive the color shift. The A‑D level therefore reflects acid vapor in the headspace rather than a direct pH reading of the cel.
How to read levels. A‑D levels are shorthand for headspace acidity ranges along a calibrated scale measured after a standardized sealed test (typically 24–48 h). For example, AD 2 (~6–8 ppmv) means the headspace averaged about six to eight molecules of acetic acid per million molecules of air during the test window — a regime where autocatalytic decay is ongoing and immediate intervention is recommended. ppmv means “parts per million by volume,” i.e., the fraction of acetic‑acid vapor in the enclosure air.
For a 1 L enclosure, convert ppmv to mg/L withC[mg/L] ≈ (ppmv × MW_acetic)/(1000 × 24.45). Thus, AD 2 (~6–8 ppmv) is about 0.015–0.020 mg/L, i.e., roughly 0.015–0.020 mg total acetic acid in the headspace.2) The Science Behind Readings
An A‑D strip reads the headspace the cel creates during a test window: the enclosed air volume where vapor accumulates. Headspace concentration rises toward an equilibrium set by partial pressure at the film surface; at true equilibrium, container volume does not change the final concentration. Volume does control the time to reach that equilibrium (and leakage/sorption can slow or cap it), which is why short tests exaggerate volume bias.
Headspace. The air volume inside a sealed enclosure around the cel (e.g., bag, sleeve, binder, or box). A‑D strips measure acid concentration in this air—not intrinsic film acidity.
A‑D strips use bromcresol green, which begins to change color at about pH 5.4. A blue strip does not mean neutral (pH 7); it just means headspace acidity is still above the 5.4 threshold meaning the cel could have experienced pH drift but is still within a "Stable" range. For context, this would mean the cel acidity level falls somewhere between Pure water (pH neutral) and Black coffee (pH 5). By the time a strip shifts toward green/yellow, vapor acidity is already well into the acidic range, and film acidity is progressing (think tomato juice -> grapefruit -> Vinegar). For time‑to‑level modeling, see our companion blog on hydrolysis and lifetime projection.
3) How to Use A‑D Strips (Standardized)
- Place a strip in the enclosure with your cel (sleeve, binder, or box). Seal the enclosure for a set test period (typically 24–48 h).
- Compare the strip color to the manufacturer’s chart and record the result/date for trend analysis.
- Standardize test volume and duration so results are comparable over time and across items.
For standardized headspace testing, keep the enclosure sealed long enough for uniform mixing (≈24–48 h). For advanced diagnostics, compare three placements (on-cel, sleeve edge, headspace) and interpret using the scenarios in the Appendix: Three-Point AD Strip Diagnostic.
4) Limitations & Sources of Error
- Not a precision instrument. Numbered levels indicate ranges; use calibrated sensors if exact ppm is required.
- Headspace ≠ film acidity. Strips read free acetic acid in air, not intrinsic film acidity.
- Strong volume dependence during finite tests. Same cel can show different levels in different volumes if the test ends before equilibrium.
- Dilution & ventilation effects. “Vinegar smell” tracks headspace concentration; open/leaky setups can mask severe cels.
- Diagnostic only. Action must follow (cold storage, scavengers, segregation).
- Not for nitrate films. A‑D strips indicate acetic acid and are calibrated for cellulose acetate. Nitrate off‑gassing follows different chemistry; IPI notes nitrate films may not shift A‑D strip color reliably. Use nitrate‑specific guidance/tests and do not rely on A‑D strips alone.
5) Best Practices (Collector Summary)
- Use A‑D strips as part of a broader strategy that stabilizes temperature and humidity; track results as a trend, not a one‑off snapshot.
- Normalize enclosure volume and duration across tests so data are comparable.
- Pair strips with hygrometers and acid scavengers; move risky items to cold storage sooner rather than later.
| A‑D Level | Approx. headspace (ppmv)† | Condition (IPI) | Technical Interpretation | Recommended Action |
|---|---|---|---|---|
| 0 (blue) | 0–0.5 | Good — no deterioration | Background hydrolysis only; vapor above ~pH 5.4 (dye threshold) | Cool/cold storage; record baseline |
| 0.5 (blue‑green) | 0.5–1 | Fair to good — deterioration starting | Detectable acid release; headspace around pH 5–5.4; pre‑autocatalytic | Increase monitoring; consider cold storage |
| 1 (green) | 1–2 | Deterioration starting | Measurable acid; headspace pH <5; still pre‑autocatalytic | Recommend cold storage; monitor closely |
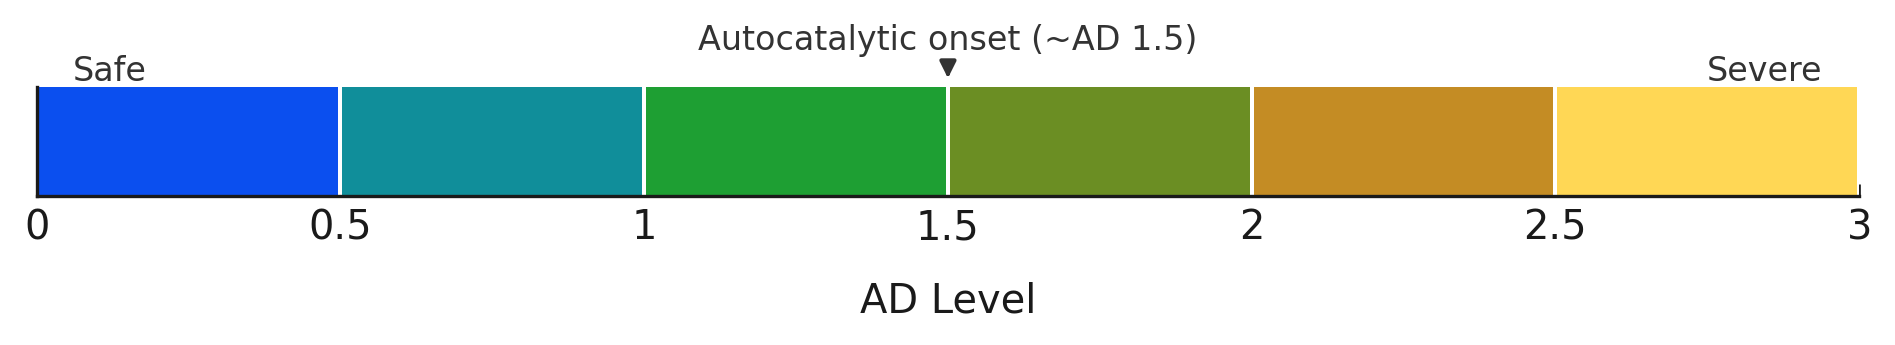
| 1.5 (green‑brown) | 3–5 | Rapid decay starting — point of autocatalytic decay | Autocatalysis begins; reaction self‑accelerates | Cold or frozen storage; segregate from collection |
| 2 (brown) | 6–8 | Poor — actively degrading | Firmly autocatalytic; structural damage incipient | Freeze if possible; copy/duplicate content |
| 2.5 (brown‑yellow) | 8–18 | Poor/Critical — rapid decline | Shrinkage/warping risk imminent | Freeze immediately; copy urgent |
| 3 (yellow) | 18–20 | Critical — shrinkage/warping imminent; handling hazard | Advanced autocatalysis; mechanical/chemical failure | Freeze immediately; triage and stabilize |
† Approximate engineering guidance; equilibrium values vary with volume, leakage, sorption, and duration.
Once a strip reads around AD 1.5, vinegar syndrome has entered its autocatalytic phase. At this point, the acid released doesn’t just signal damage — it accelerates it. Left unchecked, degradation speeds up rapidly.
For a deeper dive into why this phase is so destructive, see our companion article The Silent Killer: Vinegar Syndrome.
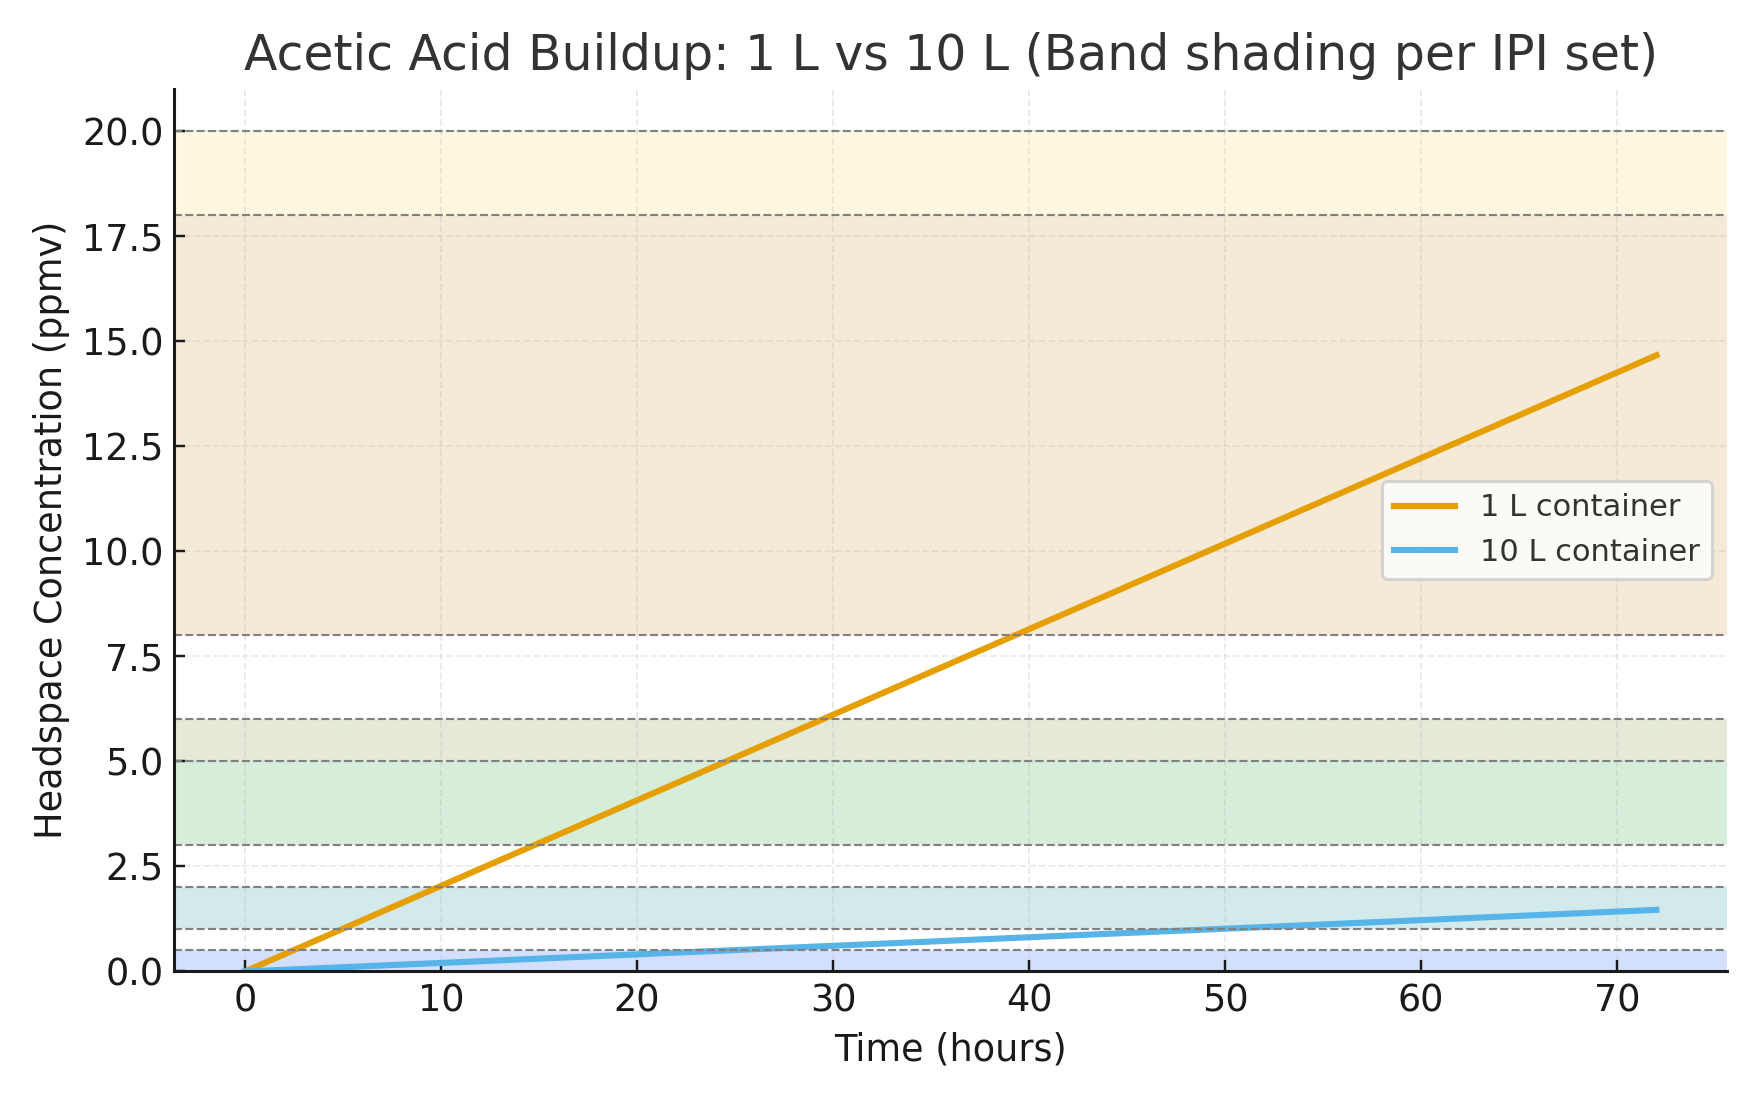
Case Study — Constant Emission, Different Volumes
Set-up. One cel emits acetic acid at a constant mass rate Q = 0.0005 mg·h−1. We run a 48 h A-D test in two sealed containers: V1 = 1 L and V2 = 10 L. Use MWacetic = 60.05 g·mol−1.
Total acid generated. After t = 48 h, M = Qt = 0.024 mg emitted into the headspace regardless of volume.
Headspace concentration.
Step 1 — Convert emission to concentration:
C (mg/L) = M / V
Step 2 — Convert mg/L to ppmv:
ppmv ≈ C × (1000 × 24.45) / MWacetic
Where:
• 24.45 = molar volume of an ideal gas at 25 °C and 1 atm (L/mol)
• 1000 converts mg to g (or L to m³ depending on unit framing)
• MWacetic = 60.05 g/mol
- 1 L: C = 0.024 mg·L−1 → ≈ 9.8 ppmv → aligns with AD ~2.5 (rapid decline).
- 10 L: C = 0.0024 mg·L−1 → ≈ 1.0 ppmv → aligns with AD ~0.5 (early warning).
Strips read concentration, not total acid. Larger headspace dilutes the same emitted mass, so at a fixed test duration the ppmv reads lower. In a true equilibrium sense (set by surface partial pressure/partitioning), the final concentration does not depend on volume — but the time to reach it scales roughly with volume for a given emission rate (C(t) = (Q · t) / V in a sealed, no-loss model). Thus, a large container can under-represent severity when tests are too short.
Practical takeaway. Standardize on a constant test volume and duration. Your results become directly comparable over time and across items, and you avoid volume-driven under-reads without needing to model the kinetics.
Closing
A‑D strips turn invisible chemistry into visible data. With standardized testing, trend logging, and timely intervention (cold storage, scavengers, segregation), collectors can act before vinegar syndrome becomes visible damage.
Further reading (Technical Papers in our Learning Center):
• Image Permanence Institute User Guide for AD Strips
• Using oversized bags/boxes for AD tests → ppm under‑reads.
• Comparing strips from different volumes or durations → misleading.
• Assuming strip color = exact ppm without considering environment.
• Use a constant, standardized test volume and duration.
• Record both the strip color and test conditions.
• Pair strip readings with other indicators (odor, pH flush, sieve uptake) for cross‑validation.
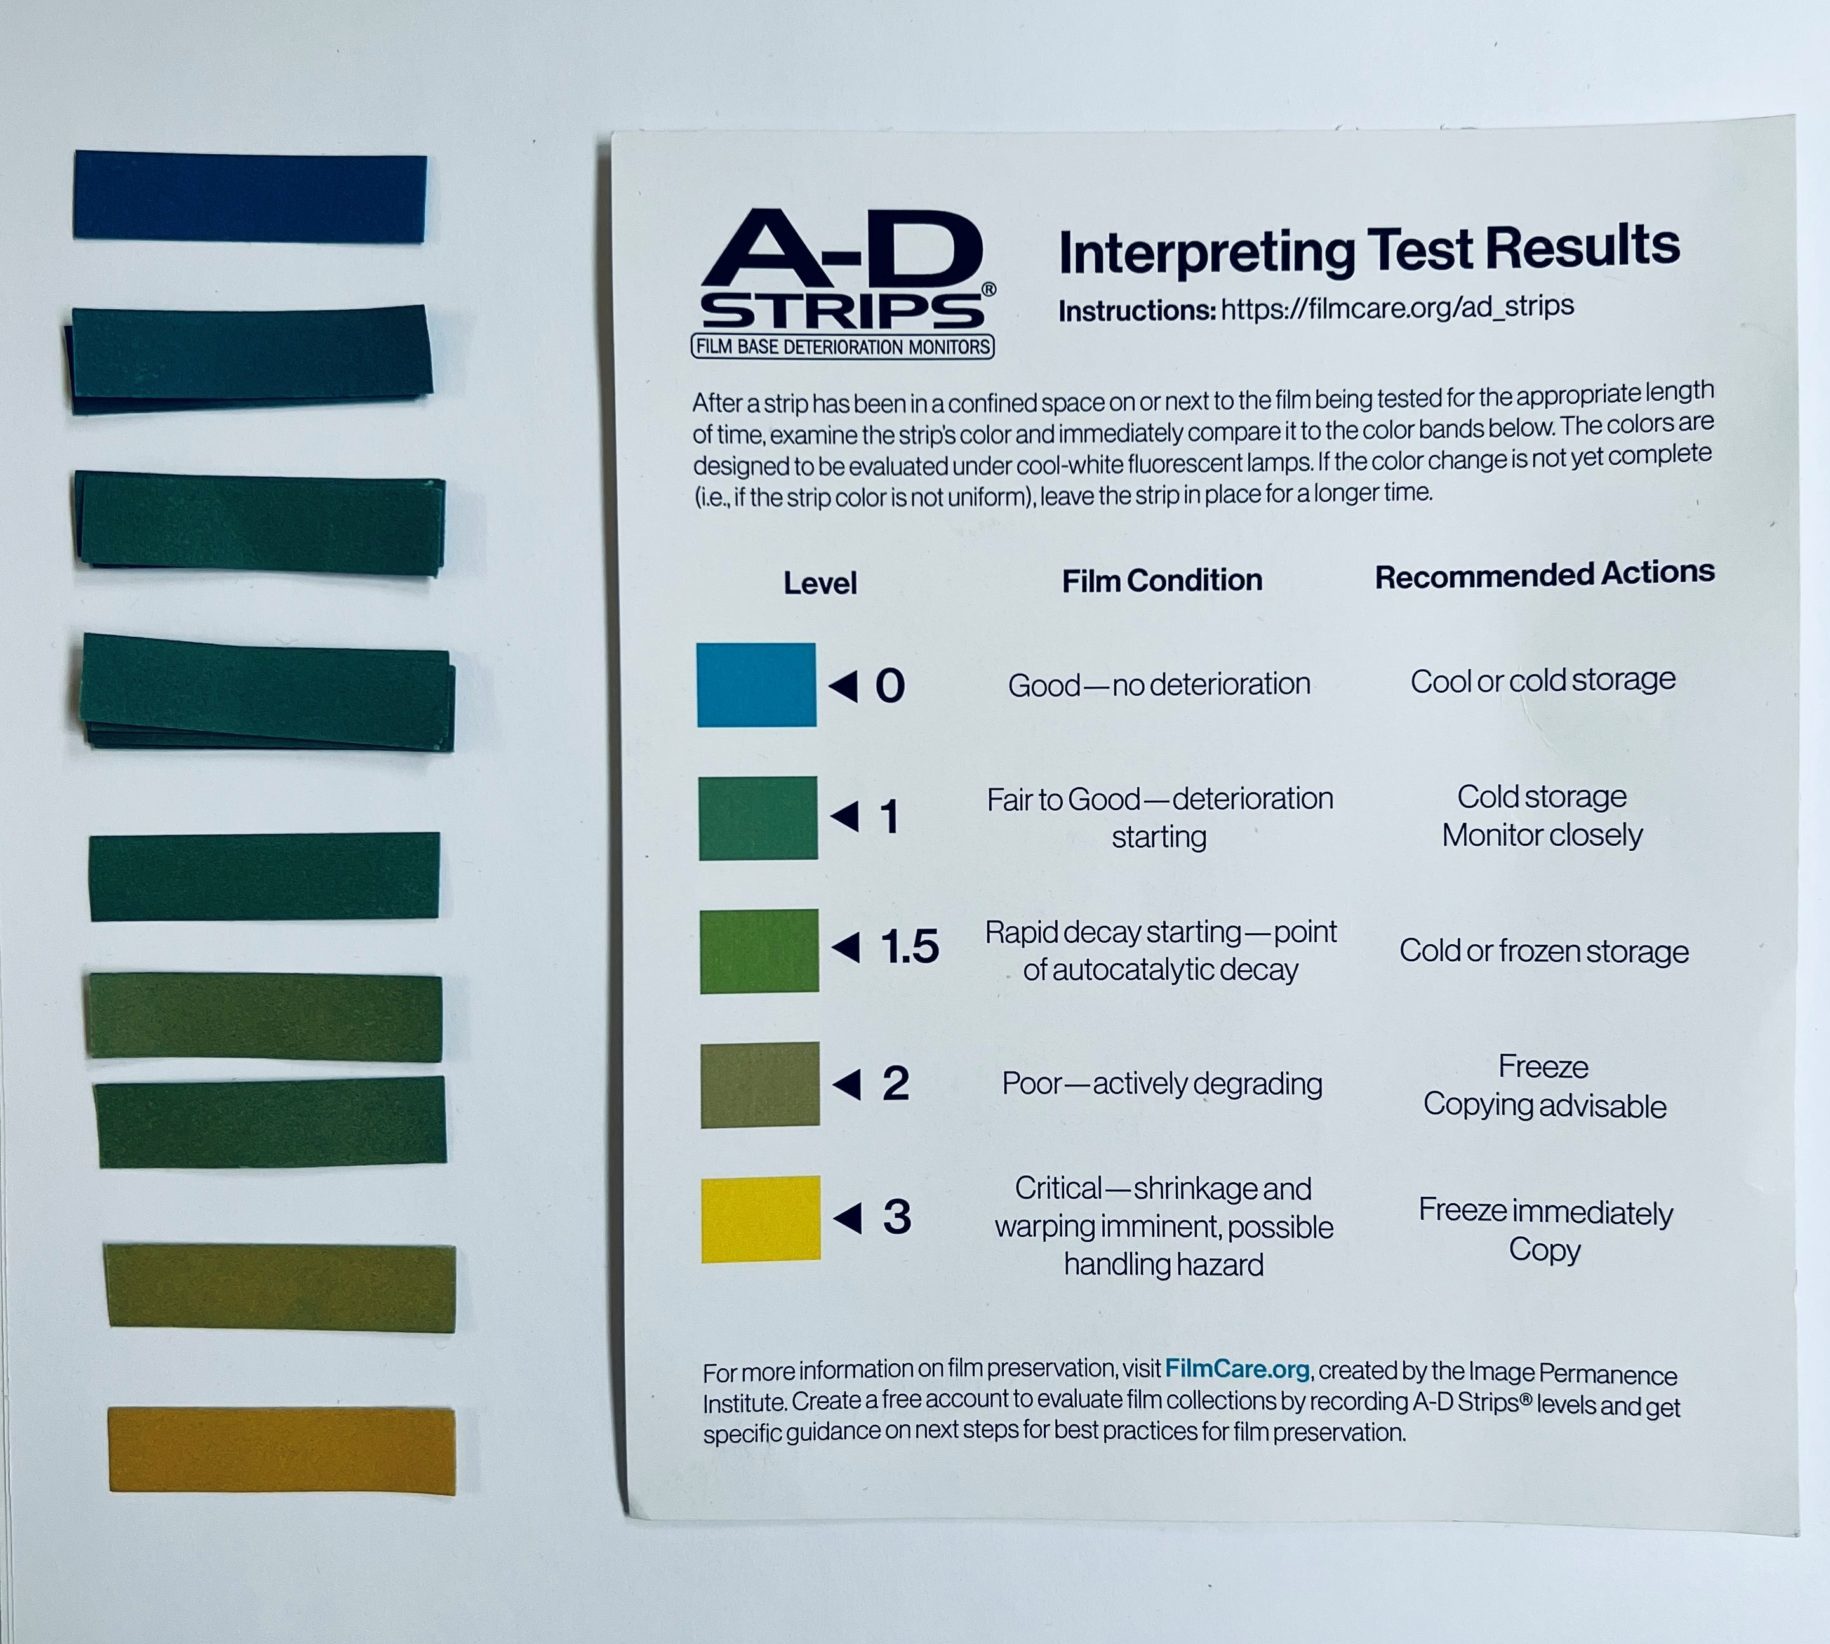
Appendix 1 — A-D Strip Color Reference (Photo)
This photo shows real A-D strip color levels (0 to 3) for visual comparison alongside the official interpretation chart.
Appendix 2 — Three-Point AD Strip Diagnostic Method
Three-Point AD Strip Diagnostic Method (Boundary Layer vs. Headspace)
What each placement actually measures
| Strip Location | What You’re Sampling | Use Case |
|---|---|---|
| 1) Directly on cel (inside an open sleeve) | Boundary layer at the film surface (highest local acidity; minimal dilution) | Early VS detection, detect diffusion bottlenecks at the paint/interface |
| 2) At sleeve opening / edge of cel | Partially mixed air escaping from the boundary layer (function of sleeve geometry + diffusion) | Neighbor-cel risk, sleeve/backing effects, placement optimization |
| 3) Headspace (container air) | Fully mixed, diluted environment (volume, air exchange, scavengers, RH, temperature) | Container design checks, ventilation/dilution performance, trend comparisons |
How to interpret results
On-cel: Green · Edge/Headspace: Blue
Cel emits, but environment handles it. Neighbor risk low.
On-cel: Blue · Edge/Headspace: Green
Acid building away from surface → poor air exchange / diffusion bottleneck.
On-cel: Green · Edge/Headspace: Green
Emission high and environment saturated → redesign or add sinks.
Safety & handling notes (important)
- Contact risk: Avoid friable/flaking paint. Prefer unpainted margins.
- Pressure/indentation: No weight. No stacking. Limit duration. Reuse the same spot if repeating to avoid multiple contact points.
- Residue: Use reputable strips. Do not wet. Remove gently; allow sleeve to “peel” the strip, not the cel.
- Temperature: Cold slows both hydrolysis and strip kinetics. A sealed “warm-check” (e.g., to ~68–72 °F) can reveal masked emission. Log temps.
- Humidity: High RH can speed hydrolysis; very low RH can change strip behavior. Note RH for proper interpretation.